Explore a world of curated content, helpful resources, and exciting updates. Sign Up below to discover more about Bio Links Tool. Do everything with one platform.
Cost / License
- Paid
- Proprietary
Platforms
- Online



Gephi is described as 'The leading visualization and exploration software for all kinds of graphs and networks. Gephi is open-source and free' and is a popular Mind Mapping tool in the network & admin category. There are more than 50 alternatives to Gephi for a variety of platforms, including Web-based, Windows, Mac, Linux and SaaS apps. The best Gephi alternative is yEd Graph Editor, which is free. Other great apps like Gephi are PlantUML, Graphviz, quiver diagram editor and Tableau.
Explore a world of curated content, helpful resources, and exciting updates. Sign Up below to discover more about Bio Links Tool. Do everything with one platform.

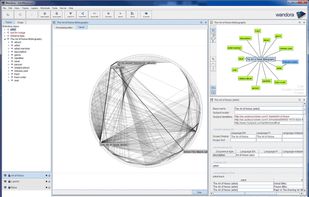
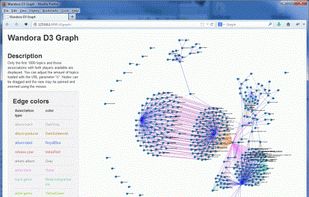
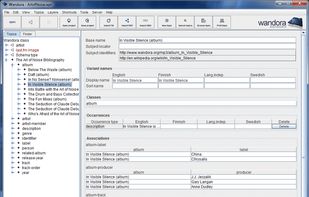
Wandora is a general purpose information extraction, management and publishing application based on Topic Maps and Java. Wandora has graphical user interface, layered and merging information model, multiple visualization models, huge collection of information extraction, import...


Looker gives you access to your organization’s data. Many users start by browsing through the reports - which we call “Looks” - and dashboards that others in their organization have already created. This page will show you how to get started browsing.
 United States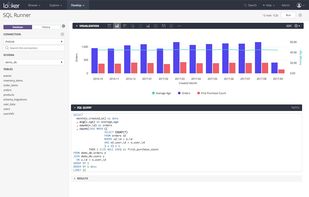


Neoclipse is a standalone workbench application to interact with Neo4j (database directory or server). It supports Cypher, index searches, visualisation, graph updates.


 Russia

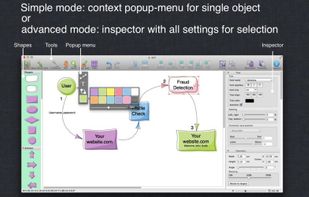


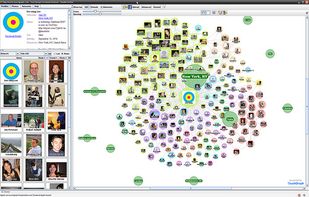
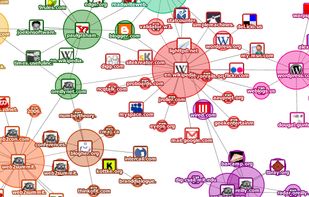
TouchGraph is the producer of data visualization software TouchGraph Navigator 2. With TouchGraph Navigator 2, users can upload data and create "interactive network visualizations."[1] Users can purchase licenses for either a TouchGraph Navigator Desktop version or...



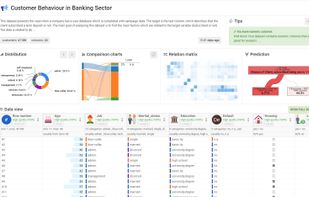
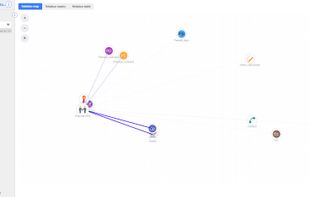
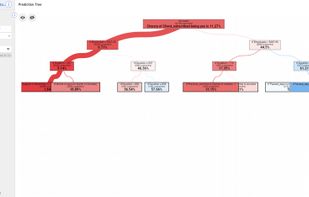
An amazing and fast data exploration tool with many unique features like prediction tree, automatic charts, relation map and report (canvas).
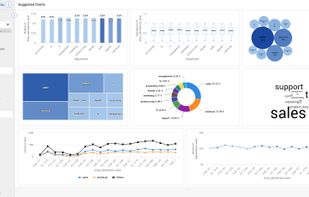


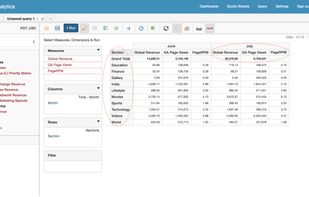
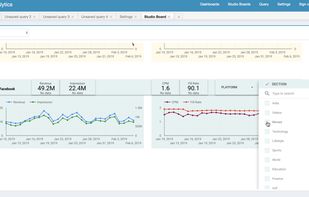
Tercept automatically aggregates and organizes all monetization data,analytics data and marketing data into one single dashboard with powerful querying and visualization capabilities. You can setup custom reports and automate 100% of your reporting.
 India
India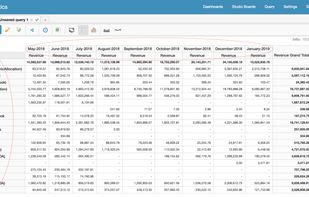



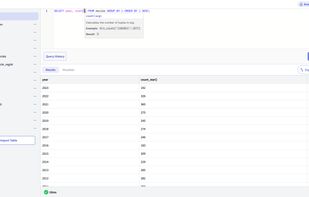
TextQuery is a desktop app that lets you import data file as a table, query it using SQL, and create stunning charts from those results.


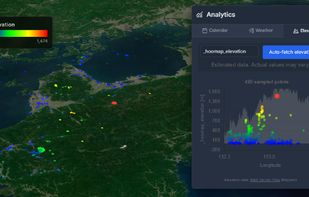
HooMap is a browser-based tool designed to transform CSV and Excel coordinate data into interactive maps in seconds. Built for researchers, students, and data enthusiasts, it allows you to visualize spatial data directly in your workflow without the need for complex GIS software...
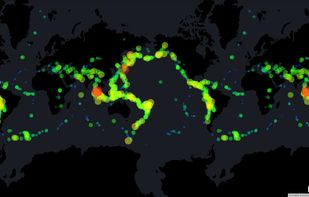
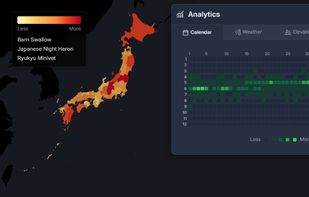
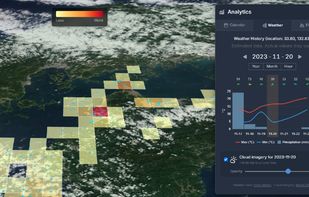


Nveil turns raw data into stunning, interactive visualizations in seconds using generative AI, no code, no templates, no design skills required.