
xenmaster's data-science tools

Data Science is more about learning concepts rather than software. These concepts include statistics, linear algebra, and ab-testing. But the following tools are the most commonly used in this practice.
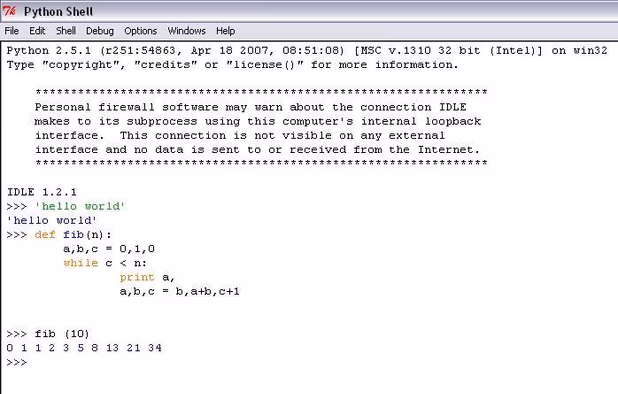
Python is an interpreted, interactive, object-oriented, extensible programming language. It provides an extraordinary combination of clarity and versatility, and is free and comprehensively ported.
Basic Computer Skills
Learning to work in the terminal is a good skill to have for anyone working in the computer science field. And no programmer's experience is complete without learning the version control power of Git!
Windows PowerShell is an extensible command-line shell and associated scripting language from Microsoft. Windows PowerShell integrates with the Microsoft .NET Framework and provides an environment for execution of cmdlets, which are specialized .NET classes implementing a particular operation, scripts, which are composition of cmdlets along with imperative logic, executables, which are standalone applications, or by instantiating regular .NET classes. These work by accessing data in different data stores, like the filesystem or registry.
Terminal (also referred to as Terminal.app) is a terminal emulator included in Apple's Mac OS X operating system. It originated in Mac OS X's predecessors, NEXTSTEP and OPENSTEP, and allows the user to interact with the computer through a command line interface. On Mac OS X, Terminal is located in the /Applications/Utilities folder.
GNOME Terminal is a terminal emulator for the GNOME desktop environment written by Havoc Pennington and others. Terminal emulators allow users to execute commands using a real UNIX shell while remaining on their graphical desktop.[
Git is a free & open source, distributed version control system designed to handle everything from small to very large projects with speed and efficiency.
Programming
Python and R are the most commonly used programming languages. I've included additional IDEs (Integrated Development Environments) as well, two for Python (one with a desktop GUI, the other for the terminal) and one for R.
The Jupyter Notebook is a web application that allows you to create and share documents that contain live code, equations, visualizations and explanatory text. Uses include: data cleaning and transformation, numerical simulation, statistical modeling, machine learning and much more.
IPython is an interactive shell for the Python programming language that offers enhanced introspection, additional shell syntax, syntax highlighting, tab completion and rich history. It is a component of the SciPy package.
R is a free software environment for statistical computing and graphics. It is a GNU project which is similar to the S language and environment which was developed at Bell Laboratories (formerly AT&T, now Lucent Technologies) by John Chambers and colleagues. R can be considered as a different implementation of S. There are some important differences, but much code written for S runs unaltered under R.
R is a whole language with its working bundled application as specially the "de facto" standard for data analysis and data mining. Better suited for advanced users who want all the power in their hands.
RStudio™ is an integrated development environment (IDE) for R. RStudio combines an intuitive user interface with powerful coding tools to help you get the most out of R.
RStudio brings together everything you need to be productive with R in a single, customizable environment. Its intuitive interface and powerful coding tools help you get work done faster.
RStudio is available for all major platforms including Windows, Mac OS X, and Linux. It can even run alongside R on a server, enabling multiple users to access the RStudio IDE using a web browser.
Like R, RStudio is available under an open source license that guarantees the freedom to share and change the software, and to make sure it remains free software for all its users.
Data Visualization and Manipulation
Matplotlib is a basic data visualization tool. SciPy is a great choice for manipulating data and TensorFlow is a fantastic platform if you are interested in machine learning (especially running with Keras.io and scikit-learn).
matplotlib is a python 2D plotting library which produces publication quality figures in a variety of hardcopy formats and interactive environments across platforms. matplotlib can be used in python scripts, the python and ipython shell (ala MATLAB®* or Mathematica®†), web application servers, and six graphical user interface toolkits.
SciPy (pronounced "Sigh Pie") is open-source software for mathematics, science, and engineering. It is also the name of a very popular conference on scientific programming with Python. The SciPy library depends on NumPy, which provides convenient and fast N-dimensional array manipulation.
TensorFlow is an open source software library for machine learning in various kinds of perceptual and language understanding tasks. It was originally developed by the Google and later released under the Apache 2.0 open source license on Nov 9, 2015
Databases
Below are the most commonly used databases for raw data processing power. I've included a relational database and a noSQL database for handing document driven data, particularly useful in the big-data space!
PostgreSQL is a powerful, open source object-relational database system. It has more than 15 years of active development and a proven architecture that has earned it a strong reputation for reliability, data integrity, and correctness. It runs on all major operating systems, including Linux, UNIX (AIX, BSD, HP-UX, SGI IRIX, Mac OS X, Solaris, Tru64), and Windows. It is fully ACID compliant, has full support for foreign keys, joins, views, triggers, and stored procedures (in multiple languages). It includes most SQL:2008 data types, including INTEGER, NUMERIC, BOOLEAN, CHAR, VARCHAR, DATE, INTERVAL, and TIMESTAMP. It also supports storage of binary large objects, including pictures, sounds, or video. It has native programming interfaces for C/C++, Java, .Net, Perl, Python, Ruby, Tcl, ODBC, among others, and exceptional documentation.
pgAdmin is the most popular and feature rich open source administration and development platform for PostgreSQL, the most advanced open source database in the world. The application may be used on Linux, FreeBSD, Solaris, Mac OSX and Windows platforms to manage PostgreSQL 7.3 and above running on any platform, as well as commercial and derived versions of PostgreSQL such as Postgres Plus Advanced Server and Greenplum database.
pgAdmin is designed to answer the needs of all users, from writing simple SQL queries to developing complex databases. The graphical interface supports all PostgreSQL features and makes administration easy. The application also includes a syntax highlighting SQL editor, a server-side code editor, an SQL/batch/shell job scheduling agent, support for the Slony-I replication engine and much more. Server connection may be made using TCP/IP or Unix Domain Sockets (on *nix platforms), and may be SSL encrypted for security. No additional drivers are required to communicate with the database server.
pgAdmin is developed by a community of PostgreSQL experts around the world and is available in more than a dozen languages. It is Free Software released under the PostgreSQL License.
MongoDB is a document database with the scalability and flexibility that you want with the querying and indexing that you need
MongoDB stores data in flexible, JSON-like documents, meaning fields can vary from document to document and data structure can be changed over time The document model maps to the objects in your application code, making data easy to work with Ad hoc queries, indexing, and real time aggregation provide powerful ways to access and analyze your data MongoDB is a distributed database at its core, so high availability, horizontal scaling, and geographic distribution are built in and easy to use
MongoDB is free to use. Versions released prior to October 16, 2018 are published under the AGPL. All versions released after October 16, 2018, including patch fixes for prior versions, are published under the Server Side Public License (SSPL) v1.
The GUI for MongoDB. Visually explore your data. Run ad hoc queries in seconds. Interact with your data with full CRUD functionality. View and optimize your query performance. Available on Linux, Mac, or Windows. Compass empowers you to make smarter decisions about indexing, document validation, and more. Visualize, understand, and work with your data through an intuitive GUI. Modify your data with a powerful visual editing tool. Understand performance issues with visual explain plans, view utilization and manage your indices. MongoDB Compass analyzes your documents and displays rich structures within your collections through an intuitive GUI. It allows you to quickly visualize and explore your schema to understand the frequency, types and ranges of fields in your data set. Real-time server statistics let you view key server metrics and database operations. Drill down into database operations easily and understand your most active collections. Point and click to construct sophisticated queries, execute them with the push of a button and Compass will display your results both graphically and as sets of JSON documents. Modify existing documents with greater confidence using the intuitive visual editor, or insert new documents and clone or delete existing ones in just a few clicks. Know how queries are running through an easy-to-understand GUI that helps you identify and resolve performance issues. Understand the type and size of your indexes, their utilization and special properties. Add and remove indexes at the click of a button. Create and modify rules that validate your data using a simple point and click interface. CRUD support lets you fix data quality issues easily in individual documents. The Compass Plugin Framework is exposed as an API, making it extensible by users. Looking for other functionality? Install a plugin or build your own.
Business Data
I've seen the following used frequently for data visualization on the business side. Pick one or more!
D3 allows you to bind arbitrary data to a Document Object Model (DOM), and then apply data-driven transformations to the document. For example, you can use D3 to generate an HTML table from an array of numbers. Or, use the same data to create an interactive SVG bar chart with smooth transitions and interaction.
D3 is not a monolithic framework that seeks to provide every conceivable feature. Instead, D3 solves the crux of the problem: efficient manipulation of documents based on data. This avoids proprietary representation and affords extraordinary flexibility, exposing the full capabilities of web standards such as HTML, SVG, and CSS. With minimal overhead, D3 is extremely fast, supporting large datasets and dynamic behaviors for interaction and animation. D3’s functional style allows code reuse through a diverse collection of components and plugins.
Power BI for Office 365 is a self-service business intelligence (BI) solution delivered through Excel and Office 365 that provides information workers with data analysis and visualization capabilities to identify deeper business insights about their data. With Power BI for Office 365, you can connect to data in the cloud or extend your existing on-premises data sources and systems to quickly build and deploy self-service BI solutions hosted in Microsoft’s trusted enterprise cloud.
With Power BI for Office 365, you can do more with your data:
-- Analyze and present insights with Excel in compelling visual formats from data either on premises or in the cloud. -- Share reports and datasets online with data that is always kept up to date. -- Access and stay connected to data and reports from your mobile devices wherever you are.
Tableau can help anyone see and understand their data. Connect to almost any database, drag and drop to create visualizations, and share with a click.
Whether you’re driving decisions across your organization or embedding insights into your software, app, or website – choose the analytics software that works the way people think.
Also with Tableau Public you can create and share interactive charts and graphs, stunning maps, live dashboards and fun applications in minutes, then publish anywhere on the web for free.
Microsoft Excel, part of the Microsoft 365 (Office), is Microsoft's spreadsheet application. With the Microsoft Office Fluent user interface, rich data visualization, pivot table views, and professional-looking charts are easier to create and use.
An online version, Excel Online , is also available as part of Office Online .
Distributed Cloud Computing
Some people prefer using the cloud to do their dirty data-processing work. Pick one and go for it!
Apache Hadoop is a open source software framework that supports data-intensive distributed applications licensed under the Apache v2 license. It enables applications to work with thousands of computational independent computers and petabytes of data.
Microsoft Azure and SQL Azure enable you to build, host and scale applications in Microsoft datacenters.
Amazon Machine Learning is a service that makes it easy for developers of all skill levels to use machine learning technology. Amazon Machine Learning provides visualization tools and wizards that guide you through the process of creating machine learning (ML) models without having to learn complex ML algorithms and technology. Once your models are ready, Amazon Machine Learning makes it easy to obtain predictions for your application using simple APIs, without having to implement custom prediction generation code, or manage any infrastructure.
Amazon Machine Learning is based on the same proven, highly scalable, ML technology used for years by Amazon’s internal data scientist community. The service uses powerful algorithms to create ML models by finding patterns in your existing data. Then, Amazon Machine Learning uses these models to process new data and generate predictions for your application.
Amazon Machine Learning is highly scalable and can generate billions of predictions daily, and serve those predictions in real-time and at high throughput. With Amazon Machine Learning, there is no upfront hardware or software investment, and you pay as you go, so you can start small and scale as your application grows.