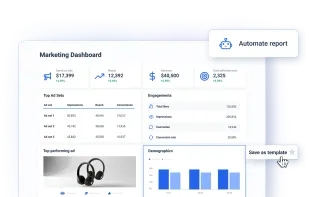
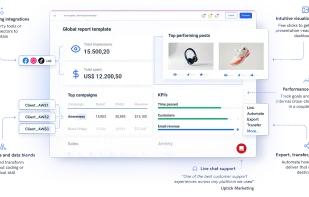
Whatagraph automates analytics reporting process by collecting data from marketing channels and presenting it as visual infographic reports. Reports are automatically generated and delivered to selected e-mail addresses.
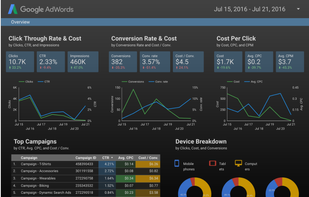
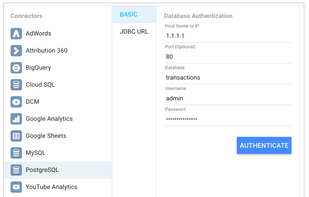
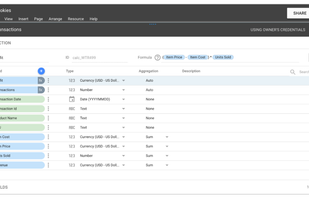
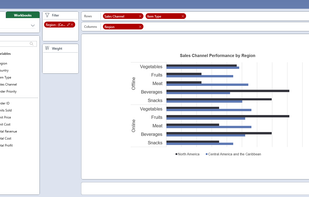
Data visualization and business intelligence (BI) platform for aggregating, sharing, collaborating, and pulling insights from raw databases, as well as built-in connections to Google products.
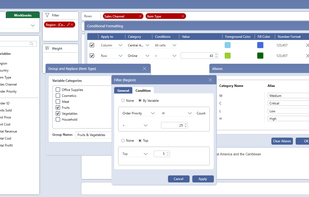
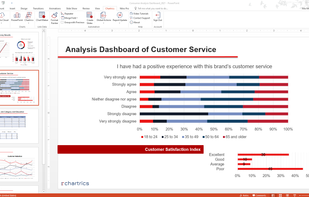
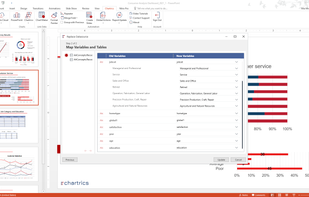
Transforms data from Excel and SPSS into updatable PowerPoint reports, visualizes with chart maker, supports sharing, and syncs analytics automatically.