ponzi2 is an open-source stock chart viewer written in Go (Programming Language) using OpenGL and GLFW.


Best alternatives are 
7 alternatives

ponzi2 is an open-source stock chart viewer written in Go (Programming Language) using OpenGL and GLFW.

Take control of your investing with award-winning charting tools, advanced analysis resources and expert commentary from StockCharts.com, featuring industry articles and news, online school to learn everything about the market and a stunning array of charts and tools for...
 United States


Chart Geany is a cross platform software solution for market technical analysis and charting. Novice and experienced investors will find a fast and easy tool to analyze stocks and other financial instruments on their desktop, and take the right decisions.
 Greece
 EU


Live crypto and US-equity charts, a free SEC EDGAR filings viewer, news, and a JavaScript backtester — all in floating windows in a browser tab. No account, no install.
 United Kingdom



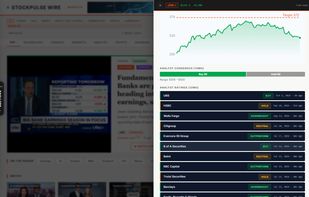
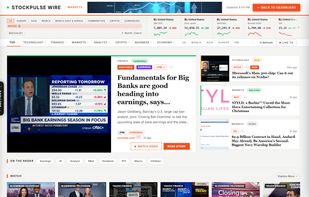
Free AI stock forecasts for 100+ popular stocks, with technical indicators, Wall Street analyst targets, live market news and movers. Paid plans unlock pro tools.
United States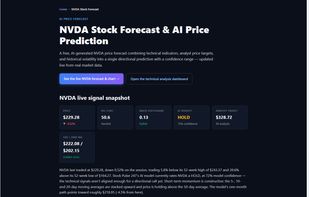


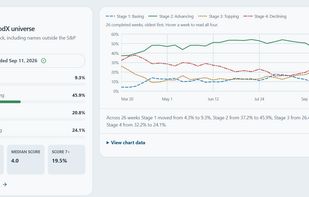
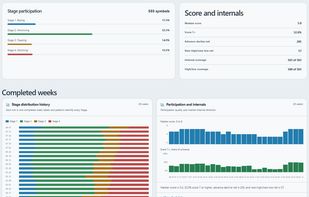
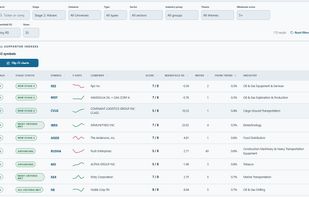
Weekly Stage Analysis covers 1,900+ stocks with eight-check Stage scores, market breadth, heatmaps, screeners, scans, charts, and watchlists.
United States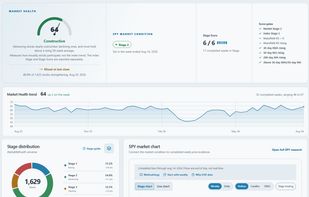

A charting app for Interactive Brokers traders that turns your technical analysis into trading rules: export your drawings, levels, notes & indicators as usable data, or hand it to your AI to codify.
United States



Vela by LuxAlgo is a next-generation charting platform with Quant, our coding agent, built in and 800+ advanced tools. Free to start.
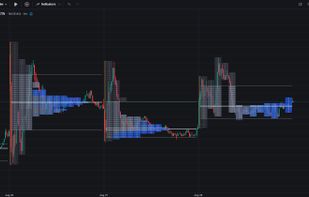
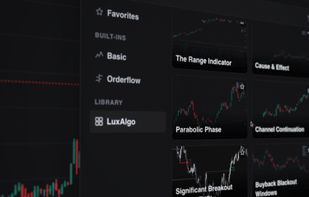
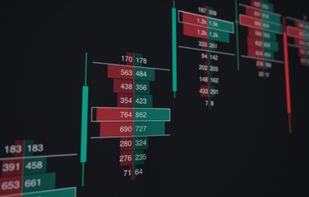

Taurigo is an online platform that provides investors with AI-powered tools for comprehensive stock analysis, interactive screeners, portfolio tracking, and comparison features to support informed investment decisions.


 Tradizerand


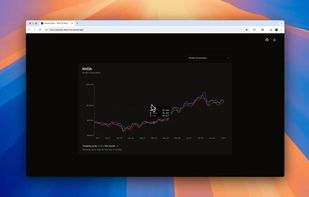
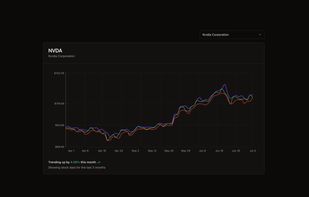
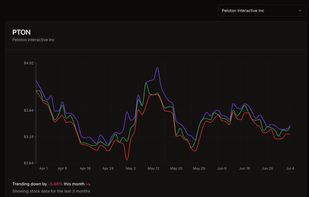
A real-time stock charting app built with Next.js, TailwindCSS, and Shadcn/UI. It uses React Server Components, Suspense, and Streaming for server-rendered stock price data from the Polygon.io API. Setup takes 2 minutes with a one-click deploy to Vercel option.


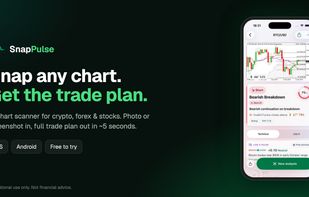
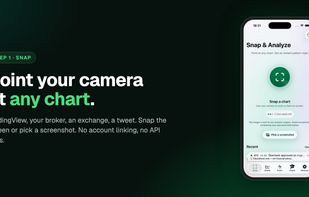
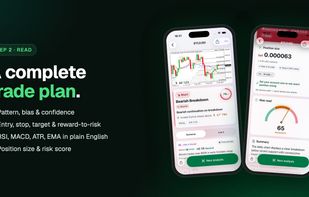
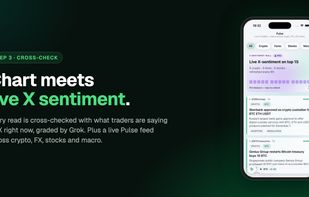
SnapPulse reads any candlestick chart from a photo or screenshot and returns a full trade plan in about 5 seconds: pattern, support/resistance, RSI/MACD/ATR/EMA in plain English, entry, stop, target, reward-to-risk, position size and a risk score.
United States