Cost / License
- Freemium (Subscription)
- Proprietary
Since
- Since 2022


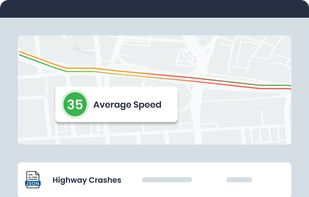
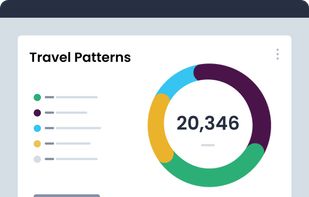
Urban SDK is a traffic data and analytics software that powers urban planning and traffic management. Its map data visualization studio allows transforming GIS data into meaningful, prescriptive insights, to help urban planners create smarter, safer cities.


DQLabs.ai is an augmented data quality platform to manage your entire data quality life cycle. With ML and self-learning capabilities, organizations can measure, monitor, remediate and improve data quality across any type of data – all in one agile, innovative self-service...


SageBow's autonomous AI agents deploy directly into your Python environment and execute end-to-end tasks.
 United States


 opencodeand
 Claude Code

Data Virtuality’s integration solutions enable detailed insights from real time and historical data with any BI tool. By combining data virtualization with an automated ETL engine, customers benefit from reducing their data integration effort by 80%.


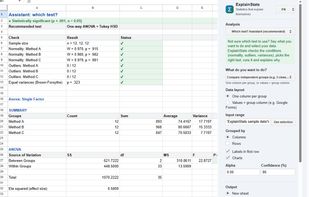
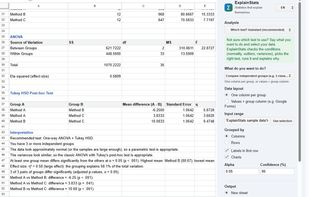
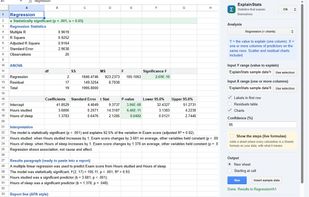
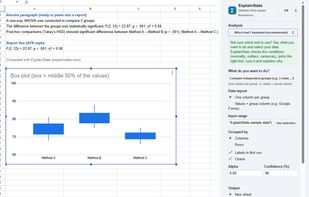
ExplainStats adds 30+ statistical tools to Google Sheets: descriptive statistics, t-tests, one-way ANOVA with Tukey HSD, regression, correlation, chi-square, Mann-Whitney, Kruskal-Wallis, Cronbach's alpha, control charts and sample size.
 France
 EU

A fast innovator and a marketer’s choice for 3,000-plus global and local brands, LeadsRx is an unrivaled multi-touch attribution SaaS platform offering a unified and impartial view of the customer journey for optimizing ROAS.

Notably is an all-in-one space to collect, analyze, and share research. If you’re doing user interviews or open-ended surveys, Notably saves time and improves the quality of insights with methods and frameworks that researchers trust and love, powered by AI.


Plotnine is an implementation of a grammar of graphics in Python based on ggplot2. The grammar allows you to compose plots by explicitly mapping variables in a dataframe to the visual characteristics (position, color, size etc.) of objects that make up the plot.
 Uganda

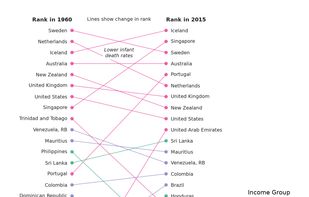
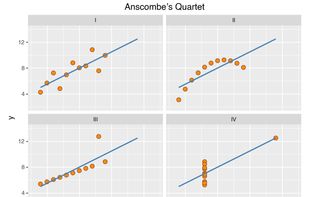
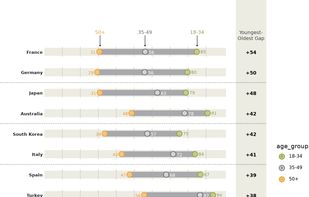

Built on a foundation of transparency, objectivity, and expert insights, Softailed allows users to easily compare vendors across different sectors, discover top-rated solutions, and receive personalized recommendations tailored to their needs.
 GermanyEU


ApX is an AutoML platform that simplifies machine learning workflows by automating data prep, model building, and tuning for faster, more efficient results.


The powerful, self serve data governance platform for businesses. Wult facilitates end to end control of data for teams and organizations. Companies need to understand their data from collection through to usage.

Connect your data, build with your agent, share with your team. BitBoard turns AI analyses into durable, traceable dashboards.
United States


The best tool for Shopee shop analytics & insights. Find potential hot products, check keyword trends, analyze shops and brands, monitor competitor shops, etc. Achieve your every opportunity!.



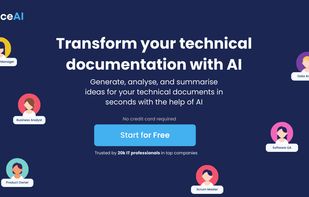
The AI productivity tool for non-technical professionals like Business analysts, Product managers, and Project managers, Data Analysts to generate and deliver technical documentation and ideas in seconds instead of days.

AI-powered business intelligence platform that lets you ask plain-English questions across Stripe, HubSpot, and other sources.
 CzechiaEU


The main purpose of EcomBlade is to provide Shopee sellers and businesses with comprehensive e-commerce market data and analytics to optimize their sales and performance.


 Trendlytic

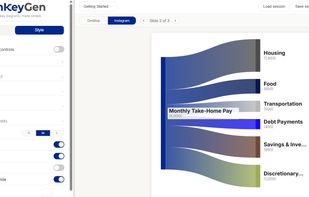
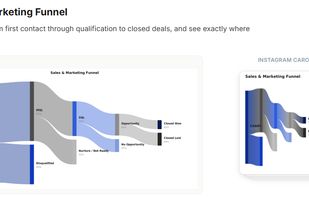
Free, no-login Sankey diagram tool with easy input via direct entry or CSV and flexible export options including SVG, PowerPoint, and Instagram Carousel.
United States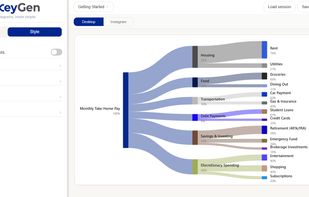


Dataflo is a data visualization platform tailor-made for leaders across the GTM functions where you can visualize, analyze, and uncover insights by building custom KPI dashboards.


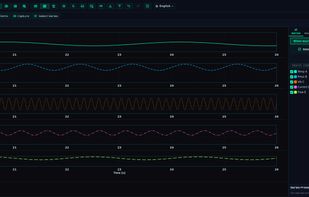
LOGADEC is time-series visualization and analysis software that runs in your web browser from a single HTML file. It needs no installation or administrator rights and makes no network connections while running, so it works on isolated test benches and locked-down corporate PCs...


Improve design-to-cost and time-to-market performance, create operating synergy between the various jobs and functions, streamline and professionalize the costing and quotation activities.
FranceEU


Manually importing data from web services into Excel is repetitive and menial. Magi Metrics makes it easy!


Neonmetrics aggregates and processes data from all your marketing platforms to help you design the perfect reports for you or your clients.


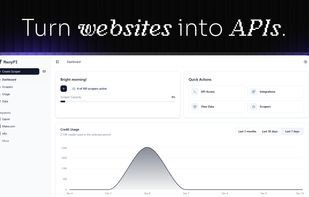
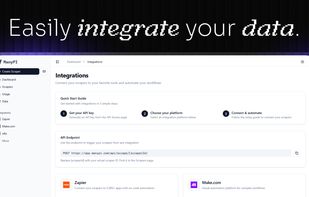
Convert any website into a clean, type-safe API. Use natural-language or JSON-schema prompts to extract data and get usable JSON output for RAG pipelines, sales, content aggregation, or research. Do it all within seconds.
GermanyEU