





ThermPort
Like
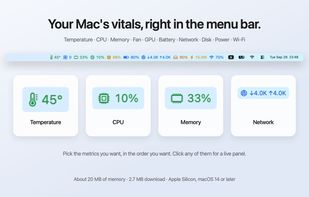
Menu bar system monitor for Apple Silicon Macs: CPU temperature, fan, memory, GPU, battery, network, disk, power and Wi-Fi with live charts.

Cost / License
- Pay once
- Proprietary
Platforms
- Mac


Features
ThermPort News & Activities
Highlights All activities
Recent activities
- ThermPort added ThermPort
 ThermPort added ThermPort as alternative to iStat Menus, Stats, TG Pro, Macs Fan Control and 1 more

ThermPort information
Developed by
ThermPortLicensing
Proprietary and Commercial product.Pricing
One time purchase (perpetual license) that costs $10.Alternatives
5 alternatives listedBadge
Get an embeddable badge for ThermPortSupported Languages


No comments or reviews, maybe you want to be first?