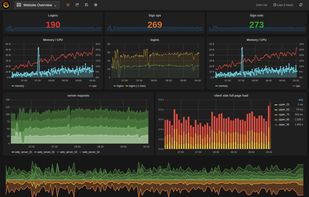
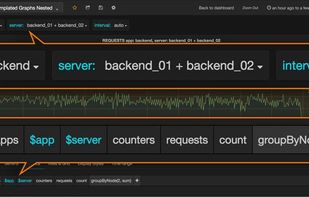
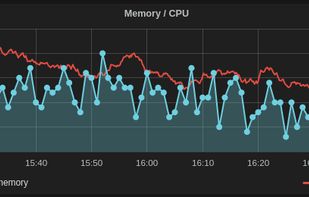
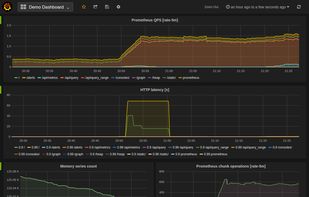
Grafana provides a powerful and elegant way to create, explore, and share dashboards and data with your team and the world.
Platforms
- Mac
- Windows
- Linux
- BSD
- Self-Hosted
- Cloudron
- Docker
- Node.JS
 Sweden
 EU



+1


Apps similar to RapidSpike include Grafana, which is open source with a free version. Other options are Uptime Kuma, UptimeRobot, Datadog and Tianji. Website Monitoring Tools like RapidSpike are a crowded field, with more than 100 alternatives for the web, Linux, Windows, Mac and self-hosting.
Grafana provides a powerful and elegant way to create, explore, and share dashboards and data with your team and the world.
SwedenEU
Self-hosted monitoring tool to track uptime via HTTP(s), TCP, Ping, and more with reactive design. Offers 20-second interval checks, notifications through various channels like Webhook, Telegram, supports multiple languages, includes status page and ping charts, aiding small to medium enterprises effectively.
 Hong Kong


Free real-time monitoring for 50 sites every 5 minutes. Custom alerts through email, SMS, calls, and apps like Slack, PagerDuty, and more. Use status pages and mobile apps for easy management.
 SlovakiaEU


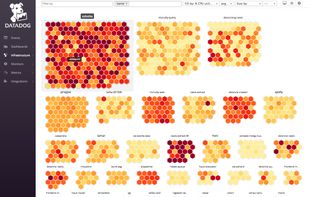
Monitor and visualize your IT and DevOps environments seamlessly with over 120 integrations, enabling real-time insight across on-premise and cloud deployments. Utilize robust analytics, graphing, and correlation tools for error logging and network monitoring. Improve collaboration and proactive IT management.
 United States
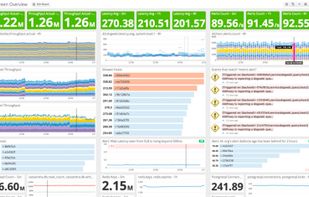
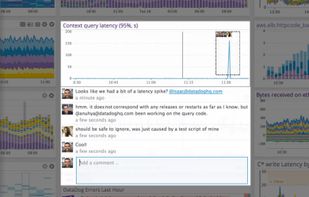


Unified analytics and uptime platform, optimized for casual users with a streamlined, deploy-anywhere approach.
 China


GlitchTip's open source platform makes monitoring software easy. Track errors, monitor performance, check site uptime all in one place. Compatible with Sentry client SDK but easier to run and entirely open source.
United States


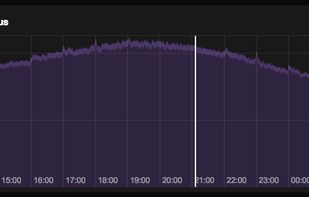
Prometheus is an open-source systems monitoring and alerting toolkit originally built at SoundCloud. Since its inception in 2012, many companies and organizations have adopted Prometheus, and the project has a very active developer and user community.
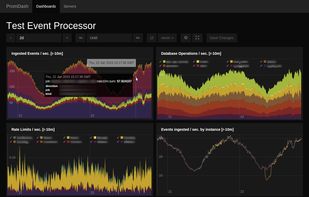
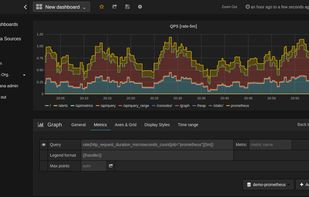


Open-source Node.js status page tool, designed to make service monitoring and incident handling a breeze. It offers a sleek and user-friendly interface that simplifies tracking service outages and improves how we communicate during incidents. And the best part?



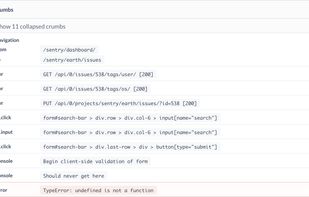
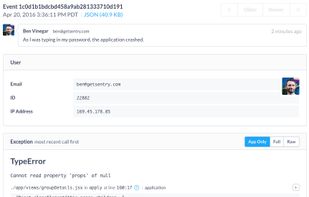
Monitors applications for errors in real time, sending alerts through email, SMS, or chat, displaying diagnostics and error location, visualizing impact by release, and providing reproducible crash details for efficient troubleshooting across teams and platforms.
United States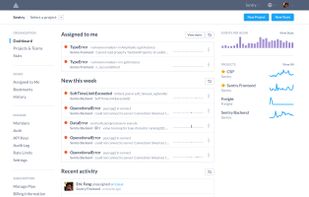


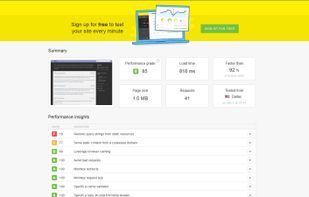
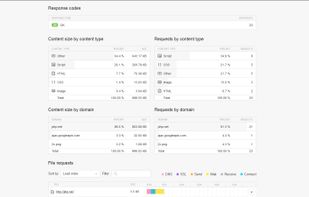
Tracks uptime, downtime, and page speed with synthetic and real user monitoring, simulates critical flows, analyzes visitor data by location, device, and browser, sends instant alerts, and provides analytics and reporting to troubleshoot and optimize sites.
United States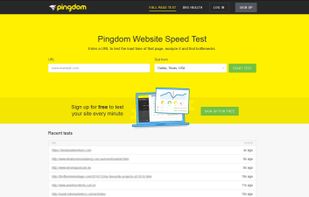


HetrixTools offers minute-by-minute global uptime monitoring with 15 free monitors, blacklist alerts for IPs and domains, and server resource tracking. Features a user-friendly design, public uptime pages, white label reports, and continuous updates for enhanced functionality.
United States


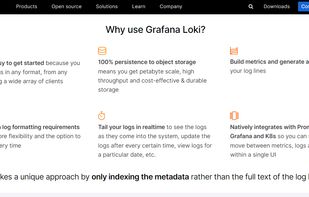
Grafana Loki is a horizontally-scalable, highly-available, multi-tenant log aggregation system inspired by Prometheus. It is designed to be very cost effective and easy to operate. It does not index the contents of the logs, but rather a set of labels for each log stream.
SwedenEU