Grafana Loki AlternativesLog Management Tools & Web Log Analyzers like Grafana Loki

Grafana Loki is described as 'Horizontally-scalable, highly-available, multi-tenant log aggregation system inspired by Prometheus. It is designed to be very cost effective and easy to operate. It does not index the contents of the logs, but rather a set of labels for each log stream' and is a Log Management tool in the network & admin category. There are more than 50 alternatives to Grafana Loki for a variety of platforms, including Linux, Web-based, Windows, Mac and Self-Hosted apps. The best Grafana Loki alternative is Better Stack. It's not free, so if you're looking for a free alternative, you could try Better Stack or Graylog. Other great apps like Grafana Loki are Prometheus, Open Web Analytics, Laravel Nightwatch and HyperDX.

Copy a direct link to this comment to your clipboard
Grafana Loki alternatives page was last updated

Alternatives list

  1. Better Stack icon
     158 likes

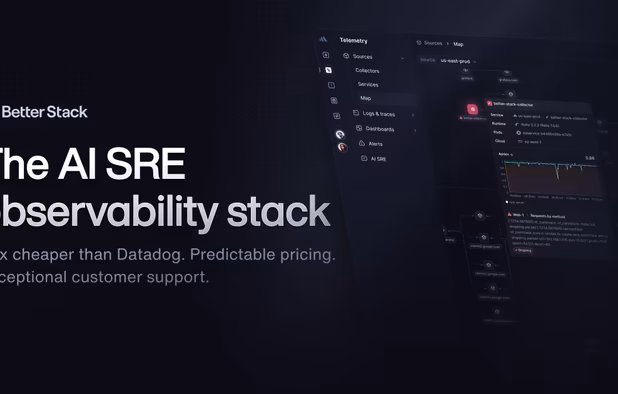
    AI-driven SRE platform offering real-time infrastructure monitoring, incident management, log analytics, traces, error tracking, metrics, real user monitoring, status pages, and a warehouse, with full data ingestion, centralized dashboard, custom alerts, and reduced costs.

    Cost / License

    • Free Personal
    • Proprietary

    Platforms

    • Online
    • Android
    • iPhone
    • Software as a Service (SaaS)
     
  2. Datadog icon
     78 likes

    Monitor and visualize your IT and DevOps environments seamlessly with over 120 integrations, enabling real-time insight across on-premise and cloud deployments. Utilize robust analytics, graphing, and correlation tools for error logging and network monitoring. Improve collaboration and proactive IT management.

    245 Datadog alternatives

    Cost / License

    • Paid
    • Proprietary

    Application type

    Platforms

    • Mac
    • Windows
    • Linux
    • Online
     
    |
    1
  3. Graylog icon
     44 likes

    Graylog is a powerful Security Information and Event Management (SIEM) solution offering a robust log analytics platform that simplifies the collection, search, analysis, and alerting of all types of machine-generated data.

    71 Graylog alternatives

    Cost / License

    • Freemium
    • Proprietary

    Application type

    Platforms

    • Self-Hosted
    • Online
    • Software as a Service (SaaS)
     
  4. Prometheus icon
     41 likes

    Prometheus is an open-source systems monitoring and alerting toolkit originally built at SoundCloud. Since its inception in 2012, many companies and organizations have adopted Prometheus, and the project has a very active developer and user community.

    77 Prometheus alternatives

    Cost / License

    • Free
    • Open Source

    Platforms

    • Mac
    • Windows
    • Linux
    • Cloudron
    • Docker Hub
     
  5. Open Web Analytics - Web Analytics – Open Source Web Analytics Framework

    The Open Web Analytics (OWA) framework provides a generic set of PHP and HTTP APIs that application developers can use to integrate web analytics into any application. The Framework also has built-in suppor.

    Cost / License

    Application type

    Platforms

    • Self-Hosted
     
    |
    1
  6. Tracks event timelines, grouped exception alerts, log searches, SQL query and job performance, third-party integrations, notifications, cache patterns, and scheduled tasks across any Laravel deployment, offering comprehensive health insights and instant setup.

    Cost / License

    • Freemium
    • Open Source (MIT)

    Platforms

    • Online
    • Laravel
    • Software as a Service (SaaS)
     
  7. HyperDX icon
     20 likes

    An open source observability platform: Unify session replays, logs, traces, and errors – all without the Datadog price tag.

    78 HyperDX alternatives

    Cost / License

    • Freemium
    • Open Source (MIT)

    Platforms

    • Software as a Service (SaaS)
    • Self-Hosted
    • Docker
     
  8. Kibana icon
     33 likes

    Open-source interface for real-time visualization, search, monitoring logs or metrics, anomaly detection, and natural language queries in Elasticsearch, supporting machine learning, automated alerting, threat detection, and integration with tools like Slack and ServiceNow.

    Cost / License

    • Freemium
    • Open Source

    Platforms

    • Mac
    • Windows
    • Linux
    • Online
     
    |
    1
  9. Logstash icon
     40 likes

    Logstash is an open source, server-side data processing pipeline that ingests data from a multitude of sources simultaneously, transforms it, and then sends it to your favorite "stash.".

    Cost / License

    • Free
    • Open Source

    Application type

    Platforms

    • Linux
    • Java Mobile
    • BSD
     
  10. VictoriaLogs, an open-source log database from VictoriaMetrics, is designed to be user-friendly. It seamlessly integrates with widely used log collectors and offers a more straightforward setup process than Elasticsearch and Grafana Loki.

    Cost / License

    Platforms

    • Self-Hosted
     
  11. Goxe  icon
     2 likes

    Goxe is a high-performance log reduction tool written in Go, designed to reduce noise in observability pipelines. It ingests logs via Syslog/UDP, normalizes and filters them, and aggregates identical or repetitive messages into a single-line format with occurrence counts.

    Cost / License

    Platforms

    • Mac
    • Windows
    • Linux
     
  12. LogMint icon
     1 like

    LogMint is a lightweight observability platform for SaaS developers and startups. Track logs, metrics, audit events, dashboards, and alerts all from a single SDK.

    Cost / License

    • Paid
    • Proprietary

    Platforms

    • Software as a Service (SaaS)
    • npm
     
12 of 66 Grafana Loki alternatives