OpenNMS is an open-source network monitoring platform that helps you visualize and monitor everything on your local and distributed networks.


+1

Grafana Loki is described as 'Horizontally-scalable, highly-available, multi-tenant log aggregation system inspired by Prometheus. It is designed to be very cost effective and easy to operate. It does not index the contents of the logs, but rather a set of labels for each log stream' and is a Log Management tool in the network & admin category. There are more than 50 alternatives to Grafana Loki for a variety of platforms, including Linux, Web-based, Windows, Mac and Self-Hosted apps. The best Grafana Loki alternative is Better Stack. It's not free, so if you're looking for a free alternative, you could try Better Stack or Graylog. Other great apps like Grafana Loki are Prometheus, Open Web Analytics, Laravel Nightwatch and HyperDX.
OpenNMS is an open-source network monitoring platform that helps you visualize and monitor everything on your local and distributed networks.
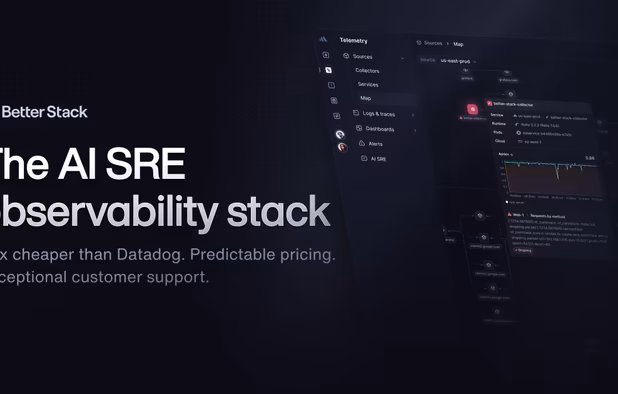
Log aggregation, search, analysis, dashboards & alerts all in one tool. Diagnose server issues faster and on one screen.
Sematext Logs is a cloud-based SaaS log management solution that offers you real-time actionable insights into your log analytics with hosted ELK as a service, in the cloud or on-premises.
Open source observability platform. SigNoz helps developers find issues in their deployed applications & solve them quickly.


OpsiMate is an open source platform that provides comprehensive infrastructure monitoring, automation, and management tools. Transform complexity into clarity with our unified, intelligent platform.


A cloud-native observability platform built specifically for logs, metrics, traces, analytics, RUM (real user monitoring — performance, errors, session replay) designed to work at petabyte scale.

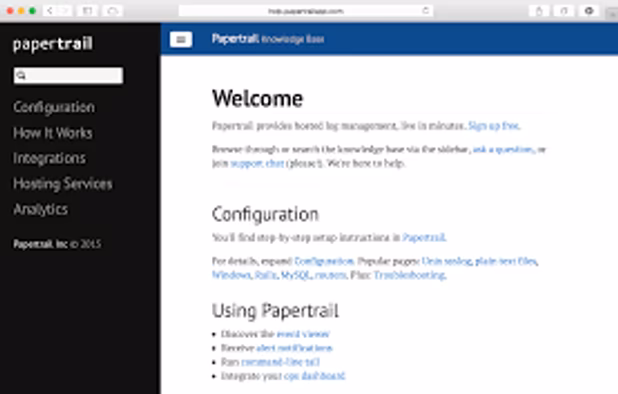
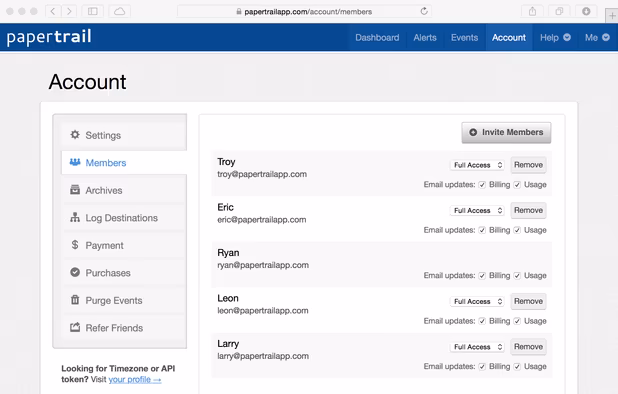
Hosted log management for servers, apps, and cloud services. Papertrail aggregates syslog, Text log files, Apache, MySQL, cloud hosting, Ruby on Rails, Windows events, Tomcat, Heroku apps, and routers & firewalls.
SenseLogs is designed to extract value from CloudWatch log data without adding complexity and delay. It is up to 10x faster than enterprise services or CloudWatch alone. How do we do it? By uniquely caching everything locally, and eliminating the minutes-long delays imposed by...


Graphite is a highly scalable real-time graphing system. As a user, you write an application that collects numeric time-series data that you are interested in graphing, and send it to Graphite's processing backend, carbon, which stores the data in Graphite's specialized...


Nagios Log Server is a powerful enterprise-class log monitoring and management application that allows organizations to quickly and easily view, sort, and configure logs from any source on any given network.


XpoLog is a log analysis and management platform with super fast index and search, problems analysis and reports for mission critical operations.


Otus is provider of SIEM, log management and event management equipment for enterprises.