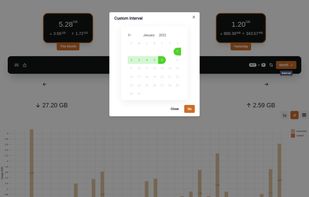
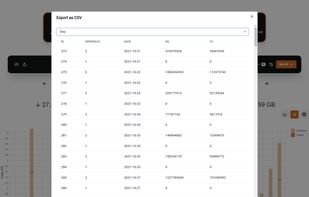
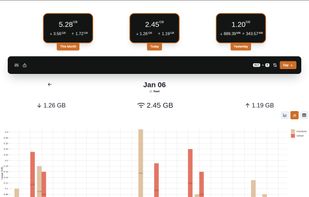
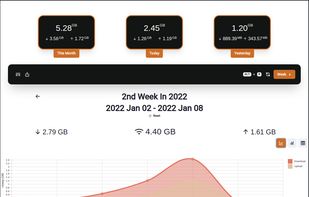
GUI Client for vnStat Network Monitor for Linux or GNU/Linux - GitHub - Hulxv/vnstat-client: GUI Client for vnStat Network Monitor for Linux or GNU/Linux
Platforms
- Linux



+2


Apps similar to Netdata include Grafana, which is open source with a free version. Other options are Zabbix, Better Stack, Datadog and Nagios. You're spoiled for choice with Network Monitors like Netdata: we list more than 50 alternatives for Linux, self-hosting, the web, Windows and Mac.
GUI Client for vnStat Network Monitor for Linux or GNU/Linux - GitHub - Hulxv/vnstat-client: GUI Client for vnStat Network Monitor for Linux or GNU/Linux

Monitoring agent using Nagios plugins providing JSON API, Prometheus metrics, Kafka integration making it able to connect to anything.
 Sweden
 EU
EU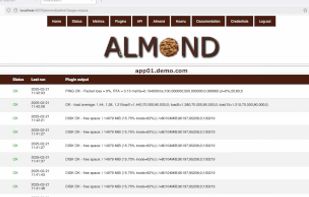
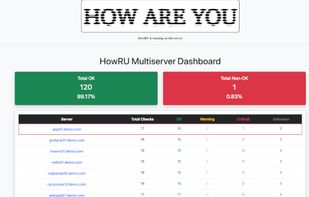


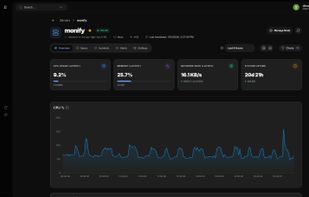
Lightweight server monitoring for developers and small teams with a Go-based agent using 12-18MB RAM, real-time dashboards, drag-and-drop builder, built-in alerts for major services, one-command setup, no need for exporters or complex configs, and a free tier for two servers.
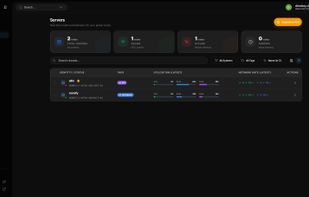


Parseable is an open source, unified infrastructure observability platform built in Rust on a data lake architecture. It tracks logs, metrics, traces, and events across apps, agents, and systems.
 United States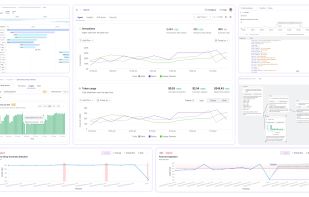


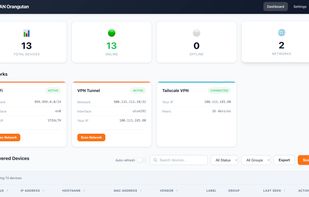
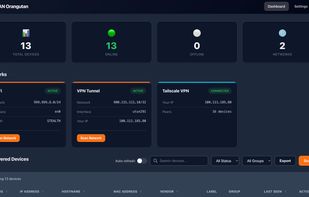
LAN Orangutan is a lightweight network scanner with persistent device labeling, multi-network support, and Tailscale integration. Built by 291 Group.


EU-hosted AI observability platform. Monitor LLM costs, latency, and compliance in one platform. GDPR and AI Act compliant.