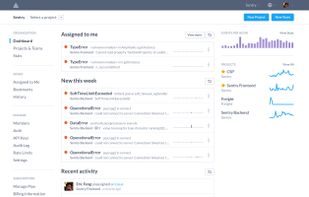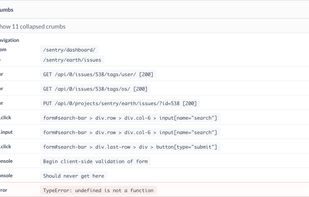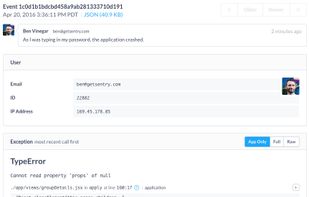
An open source observability platform: Unify session replays, logs, traces, and errors – all without the Datadog price tag.
Cost / License
- Freemium
- Open Source (MIT)
Platforms
- Software as a Service (SaaS)
- Self-Hosted
- Docker


LuxkernOS is described as 'EU-hosted AI observability platform. Monitor LLM costs, latency, and compliance in one platform. GDPR and AI Act compliant' and is an website in the development category. There are more than 50 alternatives to LuxkernOS, not only websites but also apps for a variety of platforms, including SaaS, Self-Hosted, Linux and Windows apps. The best LuxkernOS alternative is Uptime Kuma, which is both free and Open Source. Other great sites and apps similar to LuxkernOS are Zabbix, Beszel, Better Stack and Netdata.
An open source observability platform: Unify session replays, logs, traces, and errors – all without the Datadog price tag.


Prometheus is an open-source systems monitoring and alerting toolkit originally built at SoundCloud. Since its inception in 2012, many companies and organizations have adopted Prometheus, and the project has a very active developer and user community.


Open-source Node.js status page tool, designed to make service monitoring and incident handling a breeze. It offers a sleek and user-friendly interface that simplifies tracking service outages and improves how we communicate during incidents. And the best part?


Tracks uptime, downtime, and page speed with synthetic and real user monitoring, simulates critical flows, analyzes visitor data by location, device, and browser, sends instant alerts, and provides analytics and reporting to troubleshoot and optimize sites.


Monitors applications for errors in real time, sending alerts through email, SMS, or chat, displaying diagnostics and error location, visualizing impact by release, and providing reproducible crash details for efficient troubleshooting across teams and platforms.


Tracks event timelines, grouped exception alerts, log searches, SQL query and job performance, third-party integrations, notifications, cache patterns, and scheduled tasks across any Laravel deployment, offering comprehensive health insights and instant setup.


Comprehensive monitoring solution with over 200 sensor types, user-friendly interface, and powerful capabilities such as traffic analysis, failover clustering, and remote probes. Offers email and SMS alerts, supports SNMP and WMI, provides high-availability features and detailed reporting.


Lansweeper discovers Windows, Linux and Mac machines in your network. In addition, it inventories network devices such as Printers, Routers and Switches.

Monitorix is a system monitoring tool designed to monitor as many services and system resources as possible. Due to its simplicity and small size it can also be used on embedded devices.


Logstash is an open source, server-side data processing pipeline that ingests data from a multitude of sources simultaneously, transforms it, and then sends it to your favorite "stash.".


Grafana Loki is a horizontally-scalable, highly-available, multi-tenant log aggregation system inspired by Prometheus. It is designed to be very cost effective and easy to operate. It does not index the contents of the logs, but rather a set of labels for each log stream.


Provides uptime, performance, and page speed monitoring for up to 10 websites. Offers customizable alerts by email, SMS, or third-party apps, root cause analysis, mobile support, server and SSL checks, plus a free plan with detailed reports for diagnostics.