Logstash is an open source, server-side data processing pipeline that ingests data from a multitude of sources simultaneously, transforms it, and then sends it to your favorite "stash.".


Graphite Monitoring is described as 'Graphite is a highly scalable real-time graphing system. As a user, you write an application that collects numeric time-series data that you are interested in graphing, and send it to Graphite's processing backend, carbon, which stores the data in Graphite's specialized' and is an app in the development category. There are more than 50 alternatives to Graphite Monitoring for a variety of platforms, including Linux, Web-based, Windows, Mac and Self-Hosted apps. The best Graphite Monitoring alternative is Grafana, which is both free and Open Source. Other great apps like Graphite Monitoring are InfluxDB, Datadog, VictoriaMetrics and Graylog.
Logstash is an open source, server-side data processing pipeline that ingests data from a multitude of sources simultaneously, transforms it, and then sends it to your favorite "stash.".
An open-source database built for analyzing time-series data with the power and convenience of SQL — on premise, at the edge or in the cloud.
Splunk is software that provides unique visibility across your entire IT infrastructure from one place in real time. Only Splunk enables you to search, report, monitor and analyze streaming and historical data from any source.

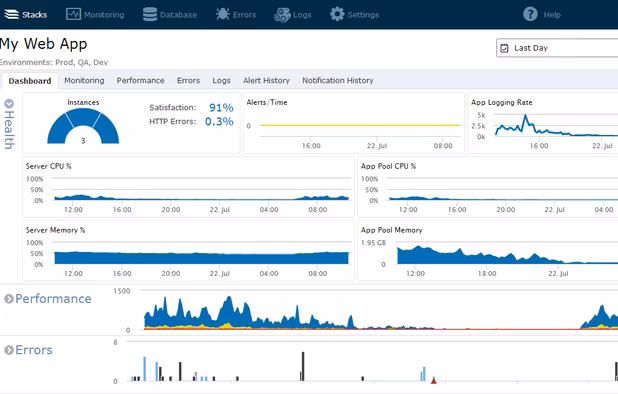
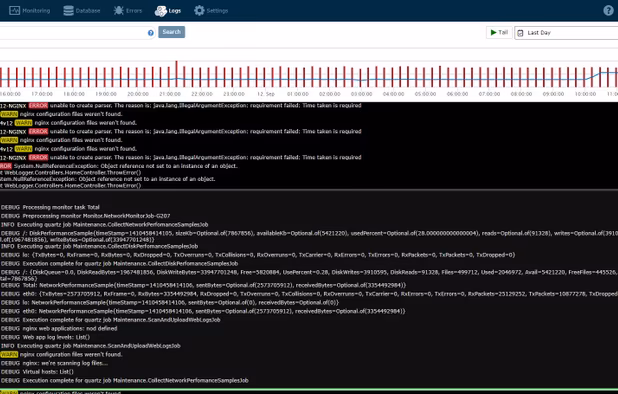
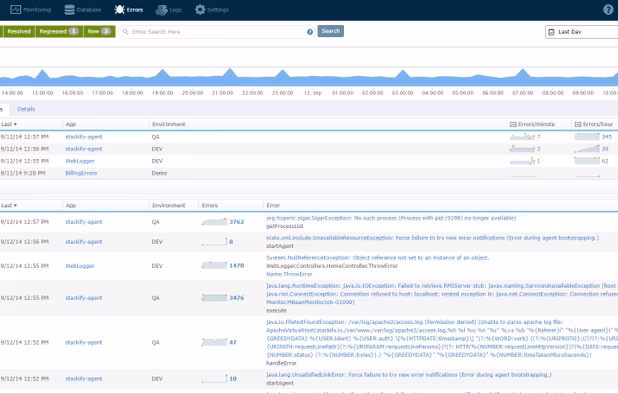
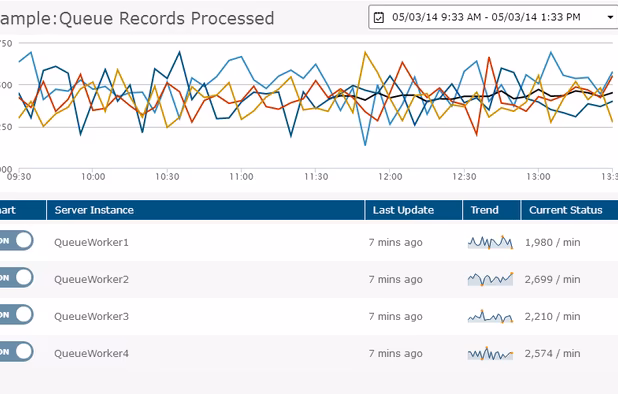
Stackify offers the only developers-friendly cloud based solution that fully integrates application performance management (APM) with error tracking and log management.
Fluentd is a fully free and open-source log management tool that simplifies your data collection and storage pipeline. It eliminates the need to maintain a set of ad-hoc scripts.
Pinpoint and solve performance issues in your Ruby, Java, .NET, PHP and Python apps with real user, application and server monitoring.

ChaosSearch specializes in data analytics and indexing solutions for large-scale cloud object storage environments. The company is innovating in data indexing and search, making it easier to access and analyze vast amounts of application telemetry data efficiently.


Rollbar collects errors that happen in your application, notifies you, and analyzes them so you can debug and fix them. JavaScript, Ruby, Python, PHP, Node.js, Android, Flash, .NET, and Java libraries are available.


Easy to use configuration web interface for nagios and neamon. openITCOCKPIT is a perfomant monitoring system with support for distributed monitoring (Satellites), REST API, nice dashboards, maps, graphs and a modular concept for easy customization.


OpenNMS is an open-source network monitoring platform that helps you visualize and monitor everything on your local and distributed networks.


Log aggregation, search, analysis, dashboards & alerts all in one tool. Diagnose server issues faster and on one screen.
Serial Studio is an open-source, cross-platform telemetry dashboard and real-time data visualization tool. It supports input from serial ports, Bluetooth Low Energy (BLE), and TCP/UDP sockets. It's ideal for embedded devices, external tools, and network services.

