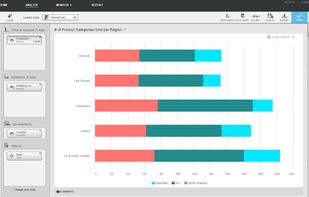


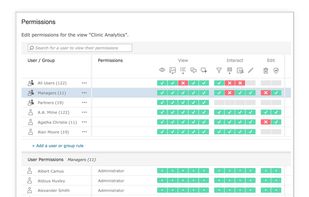
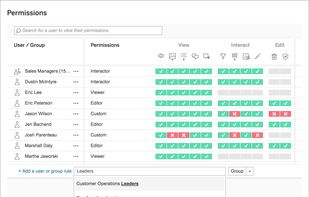
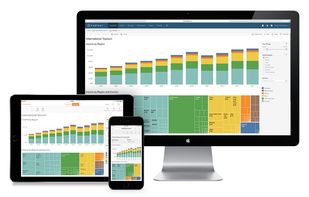
Tableau helps the world’s largest organizations unleash the power of their most valuable assets: their data and their people.
Cost / License
- Freemium
- Proprietary
Application type
Platforms
- Mac
- Windows
- Online
- Self-Hosted
 United States



+9
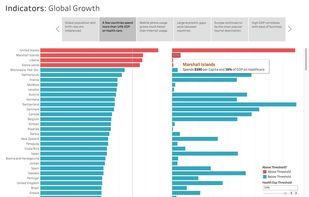


Google Fusion Tables has been discontinued. Similar apps include Tableau, which has a free version. Other options are Microsoft Power BI, Redash, Amazon QuickSight and Zoho Analytics. You can choose from more than 10 Business Intelligence Tools like Google Fusion Tables for the web, Windows, Mac, iPhone and Android.
Tableau helps the world’s largest organizations unleash the power of their most valuable assets: their data and their people.
United States
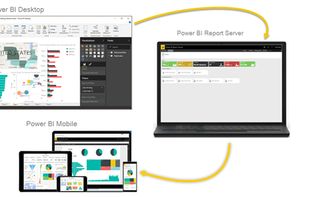
Utilize Microsoft's Power BI to convert varied data sources into interactive visual insights. It includes Power BI Desktop, online services, and mobile apps, allowing the creation, sharing, and consumption of business insights on any device, tailored to diverse business needs.
United States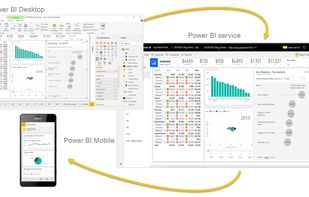

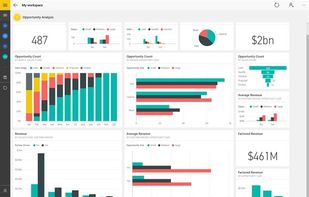


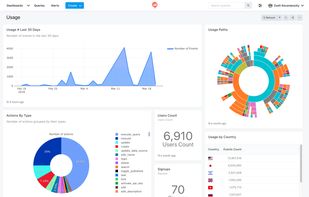
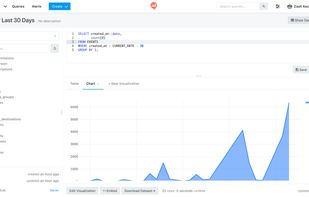
Redash helps you make sense of your data. Connect and query your data sources, build dashboards to visualize data and share them with your company.
United States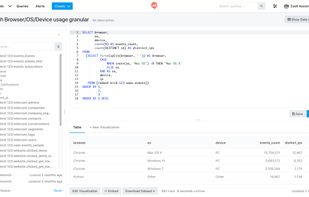


Amazon QuickSight is a very fast, cloud-powered business intelligence (BI) service that makes it easy for all employees to build visualizations, perform ad-hoc analysis, and quickly get business insights from their data.
United States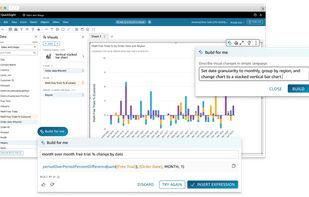
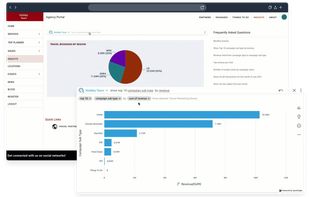
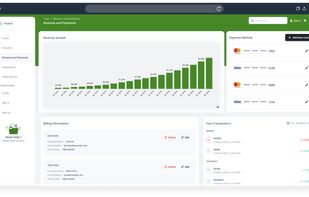


Create insightful reports & dashboards, Visually analyze your business information. Easily create insightful reports & dashboards using a drag and drop interface. No IT help required.
 India
India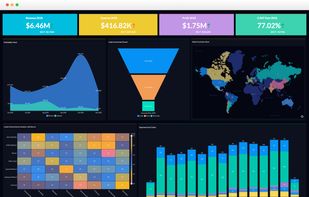


Pentaho is a Business Intelligence software company that offers Pentaho Business Analytics, a suite of open source products which provide data integration, OLAP services, reporting, dashboarding, data mining and ETL capabilities.
United States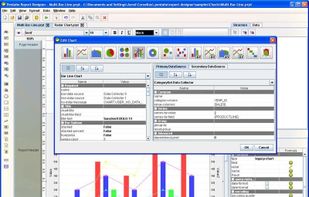


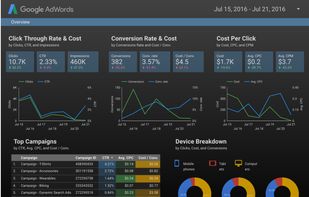
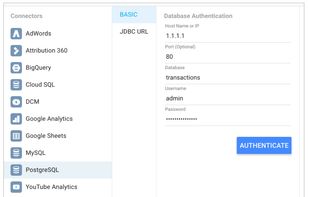
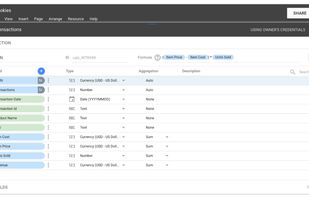
Data visualization and business intelligence (BI) platform for aggregating, sharing, collaborating, and pulling insights from raw databases, as well as built-in connections to Google products.
United States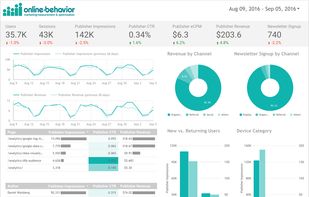


Sisense is a business intelligence and data analytics software that lets non-techies join, analyze, and visualize multiple large data sets in interactive dashboards.
United States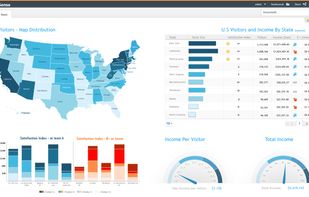


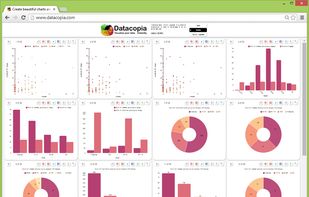
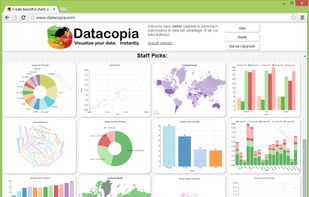
Datacopia brings you a visualization experience that's been designed from the ground up to take the pain out of making charts and graphs, so you spend less time manipulating spreadsheets, and more time understanding your data.


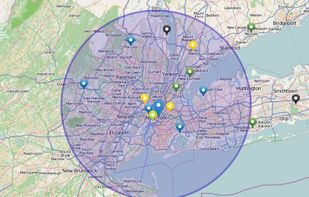
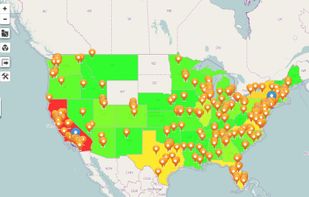
Maximize the use of your Excel spreadsheet data. Make mapping the easiest. Transform Excel data into visual analysis. We lead in data simplification and presentation. We are committed to deliver the tools needed to outpace competition.


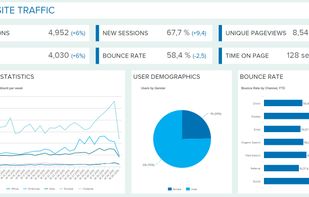
datapine enables people to explore, visualize and share data in one central analytics platform, that offers smart data connectors, a wealth of advanced BI 4.0 features and interactive dashboards.
 Germany
 EU
EU