Progress Software (NASDAQ: PRGS) is a global provider of leading application infrastructure software to develop, deploy, integrate and manage business applications.
Google Charts Alternatives
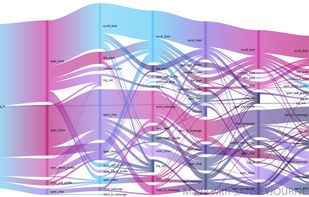
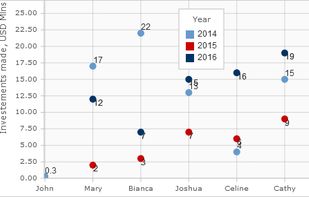
Google Charts is described as 'The Google Charts is an extremely simple tool that lets you easily create a chart from some data and embed it in a webpage. You embed the data and formatting parameters in an HTTP request, and Google returns a PNG image of the chart' and is a charting library tool in the development category. There are more than 50 alternatives to Google Charts, not only websites but also apps for a variety of platforms, including Self-Hosted, Windows, Mac and SaaS apps. The best Google Charts alternative is D3.js, which is both free and Open Source. Other great sites and apps similar to Google Charts are Tableau, RAWGraphs, Pretzel and Plotly.
Alternatives list


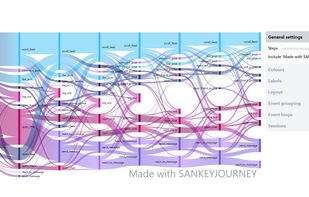
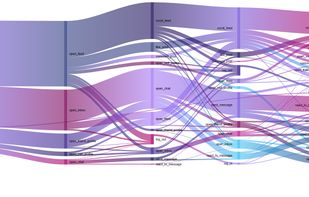
SankeyJourney is an online tool that generates customizable Sankey diagrams or flow charts for customer journey analysis with easy data uploading and interactive data visualization.
 +4
+4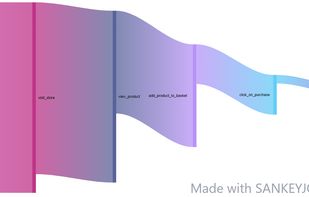

 R
R
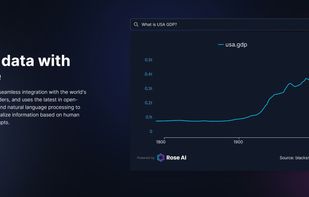
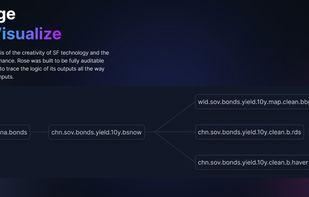
Rose is a cloud data platform designed to help users find, engage, visualize and share data. It enables integration of external and internal data, with the ability to permission data for internal teams or third parties.
Cost / License
- Free
- Proprietary
Platforms
- Online


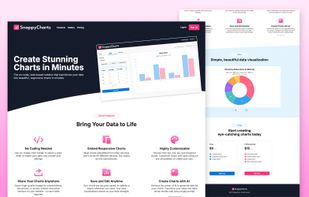
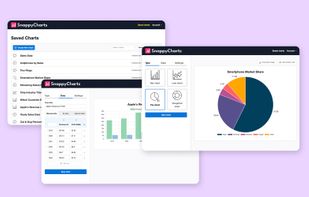
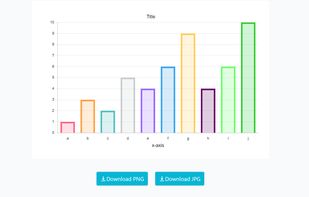
Create stunning, customizable charts online—no coding needed! Export as high-quality images or embed responsive, interactive charts on your website. AI-powered data generator included for pro accounts. Effortless data visualization for everyone!
Cost / License
- Freemium
- Proprietary
Platforms
- Online


Free JS Chart supports all essential chart types: line, scatter, vertical bar and pie. You can add a title and unlimited number of legends. The library offers customizable grid and unlimited number of chart series. Users can pan and zoom the chart as well rotate pie charts.
Cost / License
- Free
- Proprietary
Platforms
- Online
- Self-Hosted


 16 SciChart alternatives
SciChart provides GPU-accelerated chart libraries for demanding business, scientific, medical & financial applications on multiple platforms including JavaScript, iOS, Android, macOS and Windows Presentation Foundation.

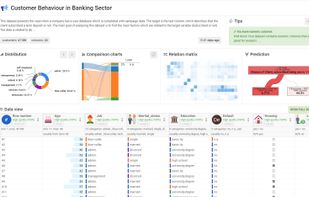
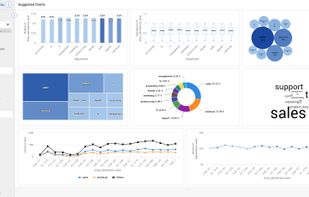
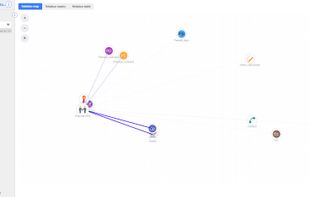
 128 AnswerMiner alternatives
An amazing and fast data exploration tool with many unique features like prediction tree, automatic charts, relation map and report (canvas).
Cost / License
- Freemium
- Proprietary
Platforms
- Online
- Software as a Service (SaaS)
 +2
+2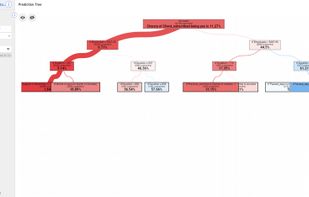


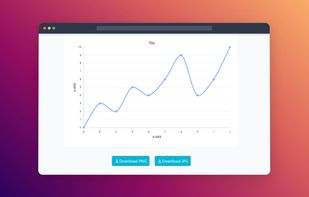
Create a line graph for free with easy to use tools and download the line graph as jpg or png file. Customize line graph according to your choice.
Cost / License
- Free
- Proprietary
Platforms
- Online
 +3
+3


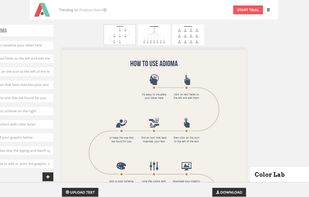
Adioma creates information graphics out of your textual data, using timelines, grids and icons. Made by designers, it takes your information and automatically follows the rules of information design to present it clearly, and beautifully.
Cost / License
- Paid
- Proprietary
Platforms
- Online


Cost / License
- Free
- Open Source
Platforms
- Self-Hosted


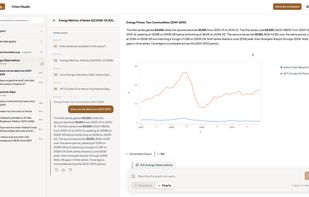
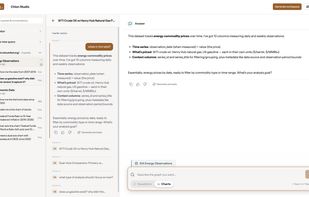
Chion turns your team's verified SQL into a portable AI analyst. Ask in plain English; get read-only SQL, charts, and grounded narratives - inside Chion Studio or exported to Claude Code, Codex, and Cursor.
Cost / License
- Paid
- Proprietary
Platforms
- Online