Google Charts Alternatives
Google Charts is described as 'The Google Charts is an extremely simple tool that lets you easily create a chart from some data and embed it in a webpage. You embed the data and formatting parameters in an HTTP request, and Google returns a PNG image of the chart' and is a charting library tool in the development category. There are more than 50 alternatives to Google Charts, not only websites but also apps for a variety of platforms, including Self-Hosted, Windows, Mac and SaaS apps. The best Google Charts alternative is D3.js, which is both free and Open Source. Other great sites and apps similar to Google Charts are Tableau, RAWGraphs, Pretzel and Plotly.
Alternatives list

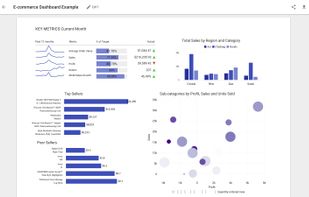
FusionCharts Suite XT helps you create interactive JavaScript charts, gauges and maps in a jiffy for all your web, mobile and enterprise applications. Using it, you can build awesome dashboards, reports, analytics, monitors, surveys that blend aesthetic elegance and actionable...
Cost / License
- Paid
- Proprietary
Platforms
- Mac
- Windows
- Linux
- Online
- Android
- iPhone
- Blackberry
- Android Tablet
- iPad


 57 Essential JS 2 for JavaScript by Syncfusion alternatives
The Syncfusion JavaScript UI controls library is the only suite that you will ever need to build an application since it contains over 60 high-performance, lightweight, modular, and responsive UI components in a single package.
Cost / License
- Paid
- Proprietary
Platforms
- Mac
- Windows
- Linux
 +2
+2


We enhance free or commercial third-party chart products with new features and emulated charts. We feature thousands of almost ready-to-use charts with Google Charts, jqPlot, Highcharts, AnyChart, FusionCharts, amCharts, CanvasJS, Syncfusion, Shield UI, and the Microsoft ASP.
Cost / License
- Paid
- Proprietary
Platforms
- Online
 +5
+5


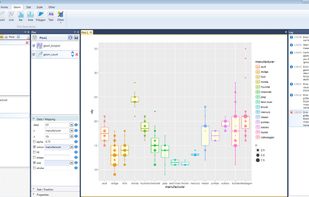
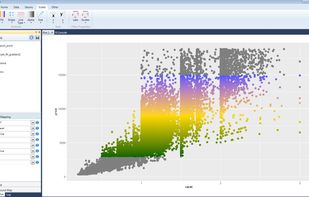
Stagraph is new professional tool for visual data exploration and statistical graphics. This tool brings data science features and functions of R language to user without the need of coding. Your workflow in software is as follows:
Cost / License
- Freemium
- Proprietary
Platforms
- Windows
 +9
+9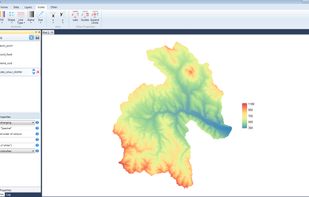


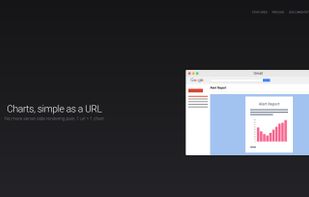
No more pain rendering charts server-side. 1 url = 1 chart, automatically generate and send them through email, chat bots or even PDF reports!.
Cost / License
- Freemium
- Proprietary
Platforms
- Self-Hosted


ArcadiaCharts is a premium JavaScript charting library for the usage in web based environments.
Cost / License
- Free
- Proprietary
Platforms
- Online


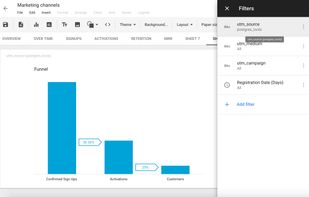
An Alternative to Google Image Charts that enables developers and marketers to embed personalized charts in their emails, Slackbots, web/mobile apps, and more.
Cost / License
- Freemium
- Proprietary
Platforms
- Online
- Self-Hosted


Slemma is a collaborative, data analytics platform designed for small to medium-sized businesses. The tool is accessible directly through the browser and doesn't need any hardware to run. This on-demand model, combined with its intuitive interface, makes it perfect for...
Cost / License
- Paid
- Proprietary
Platforms
- Online


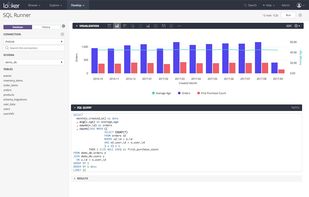
Looker gives you access to your organization’s data. Many users start by browsing through the reports - which we call “Looks” - and dashboards that others in their organization have already created. This page will show you how to get started browsing.


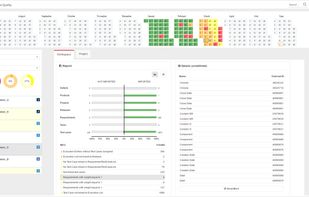
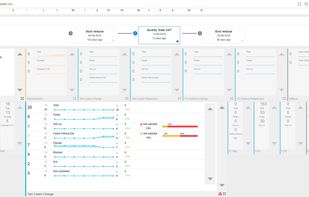
QACube is the software quality reporting and analytics solution for the complex enterprise needing greater agility. QACube delivers dynamic reporting and analytics to improve DevOps, for fact-based decision-making with faster time-to-market.
Cost / License
- Paid
- Proprietary
Application type
Platforms
- Mac
- Windows
- Linux
- Online
- Self-Hosted
- Software as a Service (SaaS)
 +2
+2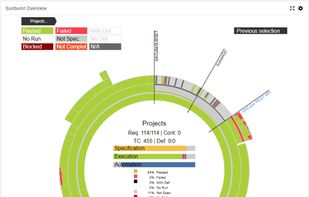


Turn boring data into a visual masterpiece using picasso.js, an open-source library from Qlik.
 +1
+1