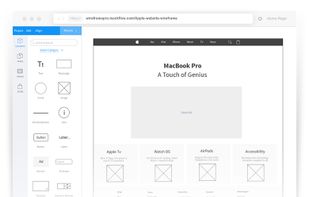
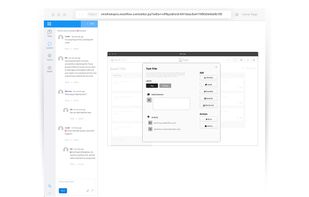
WireframePro lets you draw and collaborate on user-interface mockups for websites and apps in less time.
Cost / License
- Freemium
- Proprietary
Application type
Platforms
- Mac
- Online
 India
India




Apps similar to draw.io include Excalidraw, which is open source with a free version. Other options are LibreOffice - Draw, Dia, yEd Graph Editor and TreeSheets. There's no shortage of Diagram Editors like draw.io, with more than 100 alternatives for the web, Windows, Mac, Linux and iPad.
WireframePro lets you draw and collaborate on user-interface mockups for websites and apps in less time.
India
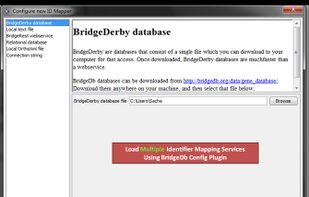
PathVisio is a free open-source pathway analysis and drawing software that allows drawing, editing and analysing biological pathways.
 Netherlands
 EU
EU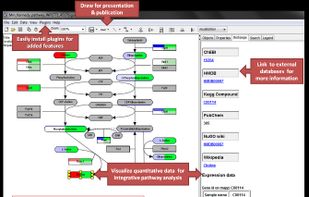


 United States

 United States


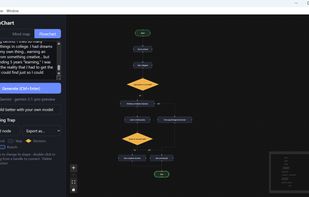
flowChart turns a plain-text description into an editable mind map or flowchart. Type "how a


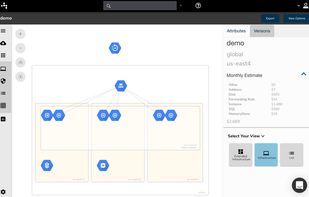
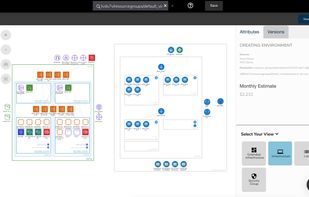
Automatically generates cloud network topology diagrams for AWS, Azure and GCP. Visualizes cloud infrastructure, tracks versions, auto updates, generates compliance reports with on embed anywhere viewer and API access.
 United Kingdom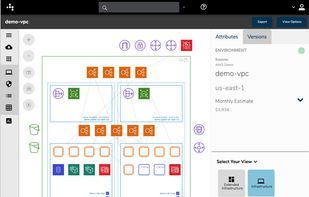
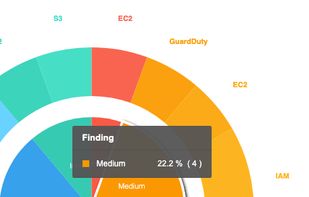


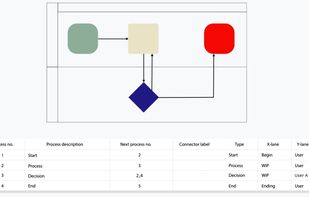
Plot your flowcharts and process flow diagrams with data instead of drawing them - just like plotting a pie chart in Excel! On top of that, generate your flowchart with our Smart Assistant using text-to-flowchart feature.



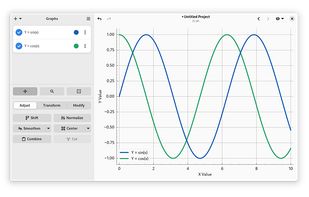
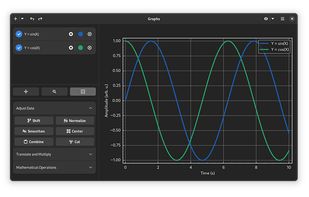
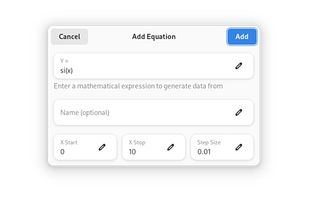
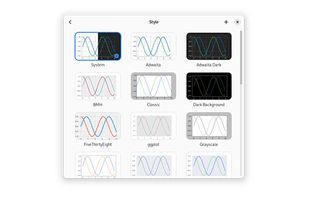
Graphs is a simple, yet powerful tool that allows you to plot and manipulate your data with ease. You can import data from two-column files or generate it via an equation. All data can be manipulated using a variety of operations such as the ability to select, cut, translate...


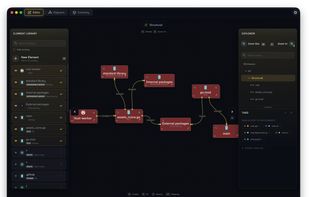
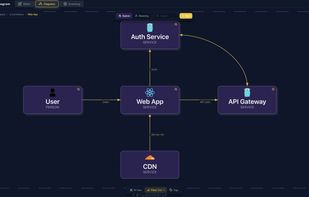
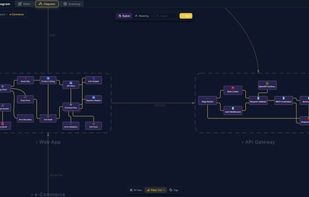
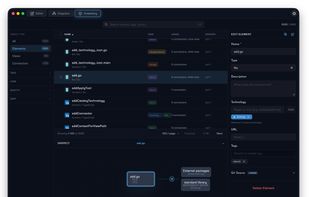
Software architecture diagramming tool. Includes a modern easy to use Frontend + Backend + CLI to enable managing diagrams from the shell or in CI.


SwordSoft Layout is an desktop application that makes it very easy for you to create, preview, and manage mockups of your website, mobile application or desktop application. With so many UI elements to choose from, you can design anything.


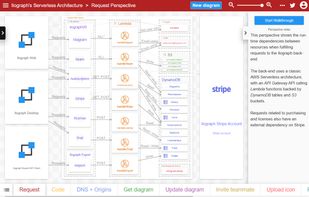
With Ilograph diagrams, you define your resources once, then show how they're related from many different perspectives. Seamlessly change perspectives to demonstrate cross-functional dependencies and shared responsibilities.


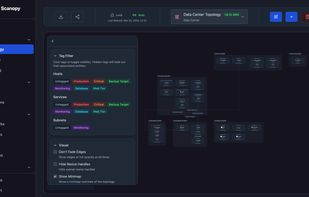
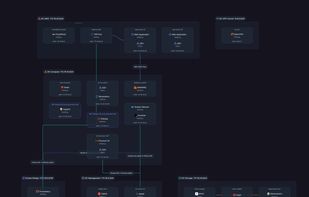
Deploy a lightweight scanner and get live network diagrams in minutes. Scanopy automatically discovers hosts, services, and connections via SNMP, LLDP, CDP, and ARP, then generates topology maps that stay current on a schedule. No manual maintenance, no stale files.
United States