


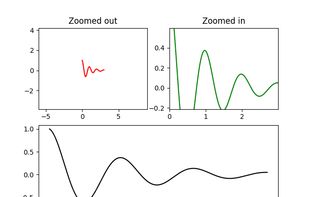
Matplotlib is a comprehensive library for creating static, animated, and interactive visualizations in Python. Matplotlib makes easy things easy and hard things possible.
Cost / License
- Freemium
- Open Source
Since
- Since 2010
 United States


+1


Apps similar to CubePlot include Matplotlib, which is open source with a free version. Other options are OriginPro, Plotly and Veusz. In total there are four Charting Library Tools like CubePlot for Windows, Linux, Mac, the web and iPhone.
Matplotlib is a comprehensive library for creating static, animated, and interactive visualizations in Python. Matplotlib makes easy things easy and hard things possible.
United States
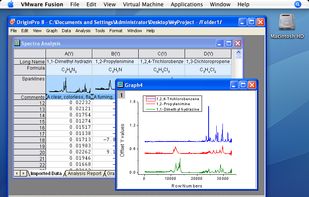
Data analysis and graphing software for scientists and engineers. It provides You with dozens of functionalities and options. The plotting engine is very effective and the plots are of high quality. A lot of statistical functionalities make data analysis very easy even for those...
United States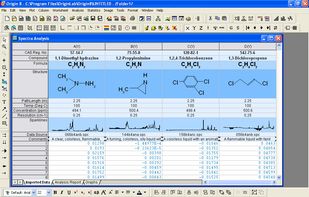


Plotly is the easiest way to graph and share data online. Open-source libraries for JavaScript (comparison with HighCharts at https://plot.ly/highcharts-alternative/), Python, R, and MATLAB.
United States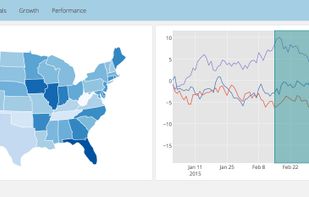
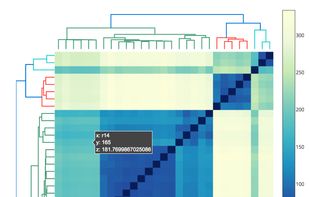
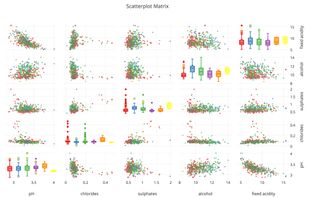


Veusz is a scientific plotting and graphing program with a graphical user interface, designed to produce publication-ready 2D and 3D plots.
 United Kingdom


