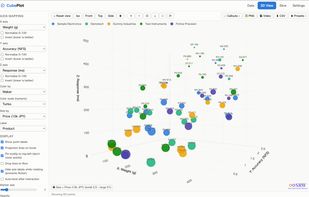
CubePlot turns a CSV file into a 3D scatter plot you can rotate and zoom. Load the file and the plot appears — there is nothing to install and no account to create.
It ships as a single HTML file (about 2 MB) that you open in Chrome, Edge or Safari. Because it is one local file, it also works with no network connection at all. External network communication is blocked by the browser's own mechanism (CSP), so the data you load is never sent anywhere. There is a separate page documenting how to verify that yourself using the browser's developer tools, if you need to clear an IT review.
The free version has no time limit and requires no sign-up: 3D view on the X/Y/Z axes, labels, slicing and trimming, and PNG/CSV export. Exported PNGs carry a watermark. The commercial license ($39, one-time, no subscription) adds colour, colour-scale and size mapping — up to five parameters at once — rotation-video (MP4) export for slide decks, and watermark-free output. It is free for students for academic use.
What it does not do: it is not a general plotting library and not a statistics package. There are no 2D chart types, no curve fitting, and no scripting. If you need those, the tools listed alongside this one will serve you better. CubePlot does one thing: it gets a CSV onto three axes, in a file you can hand to someone who does not write code.







No comments or reviews, maybe you want to be first?