


Hidden Gems helps you see what matters most in your data using automated machine learning (think KPI finder).
Cost / License
- Pay once
- Proprietary
Since
- Since 2021


+1


Best alternatives are 
5 alternatives

Hidden Gems helps you see what matters most in your data using automated machine learning (think KPI finder).

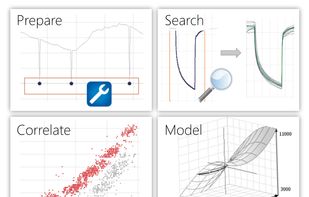
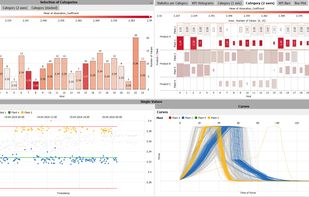
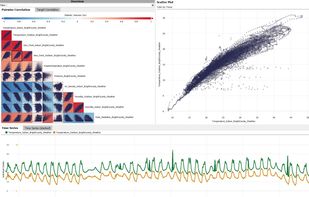
Plug-and-play visual analytics for exploring and preparing large data in much less time – from CSV, Python, and many other sources. Get from millions of data records to discovering correlations, patterns, and trends in 1 minute. No coding required.
 Germany
 EU


Sayari builds search products to find corporate, financial & public records in hard-target countries, covering emerging, frontier & offshore financial center markets, corporate registries, official gazettes, litigation, vital records, customs data.
 United States


The Snthesis Bio platform automatically integrates and harmonizes all your research data. Source agnostic. Search everything.


Become a builder. Custom reports, workflows, and integrations are made up of the same repetitive tasks. Mix and match pre-built steps to automate these tasks so you can be self sufficient.
United States

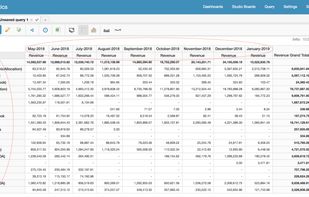
Tercept automatically aggregates and organizes all monetization data,analytics data and marketing data into one single dashboard with powerful querying and visualization capabilities. You can setup custom reports and automate 100% of your reporting.
 India

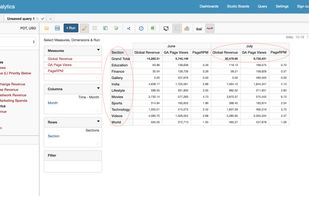
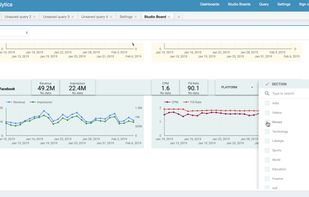

World's Simplest AI Powered Cloud-based Data Analytics Tool. Get actionable insights or hidden anomalies from your data in the form of Charts and Stories with a simple tool ...

 SpainEU


A Cloud Platform for Data Science and Big Data Analytics Collaborate on, scale, and deploy data analysis and advanced analytics projects radically faster. Use the most powerful tools — R, Python, JavaScript, Redshift, Hive, Impala, Hadoop, and more — supercharged and integrated i.


Run your code faster, without the infrastructure hassle
Domino makes it easy to run your Python, R, MATLAB, and Julia code on more powerful hardware with one command, so you can get your results faster. Customers tell us these features can reduce set-up and configuration times b.

Ranet OLAP UI controls for HTML5, WPF, and Silverlight allow users to easily create pivot tables and reports.
 CyprusEU


MaxStat is a statistical software for scientific data analysis and charting. MaxStat is very easy to use, and was designed for students and young researchers with little background in statistic. But also more established researchers enjoy the easiness of doing statistic with...
GermanyEU


User-Friendly Data Retrieval
Your Data Holds the Answers to Key Business Questions
Teldware makes it readily accessible.
Our flagship product and company namesake, Teldware, is the answer to your data retrieval issues.
Ideal for corporations, government, or any medium to ente.


Logi Vision is a self-service visual analytics application that guides users through their analysis step by step. With Vision, users can easily blend cloud and corporate data, collaborate, and share insights with their teams using familiar social tools, making powerful visual...
United States


With a rich palette of plot types, filter devices and an editable table of data Vortex enables your scientists to rapidly identify outliers and spot trends in multi-dimensional data.


Professional and easy to use Project and Document and CRM management solution. Create documents, manage Cases or Projects, track business events, scan, search, share and streamline your business. InteliDoc works on Lotus Notes and Lotus Domino.

MarketSight® is a web-based data analysis platform for analyzing and visualizing survey results and other market data. It is ideal for creating crosstabs, automatically running statistical tests, creating charts, designing and hosting dashboards, viewing and editing data...


HPCC Systems offers an open source cluster computing platform used to solve Big Data problems. Its unique architecture and simple yet powerful data programming language (ECL) makes it a compelling solution to solve data intensive computing needs.
United States


Dundas Dashboard is flexible, powerful dashboard software lets you quickly create business and performance dashboards. Visualize your data & take action!


Logi Info is a rapid development platform that delivers a full range of powerful and interactive dashboards, reports and self-service analytic capabilities. Info creates engaging experiences that can be deployed to the broadest range of users within the applications they’re...
United States


Wizard is a new Mac app that makes data analysis easier than ever. No programming, no typing — just click and explore. Wizard includes a full set of tools for doing professional research, yet its friendly interface makes statistics accessible to beginners.
United States


 R (programming language)

Online tool for monitoring your key business metrics independently of the source of data


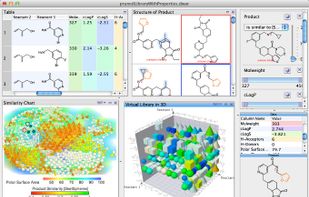
DataWarrior combines dynamic graphical views and interactive row filtering with chemical intelligence. Scatter plots, box plots, bar charts and pie charts not only visualize numerical or category data, but also show trends of multiple scaffolds or compound substitution patterns.


Kirix Strata™ is an ad hoc data analysis and reporting tool built for people who work with, manipulate and analyze structured data. Strata is easy to use, has the power you need to work with large files, and helps you get your work done faster.


