WinDbg Alternatives
WinDbg is described as 'multipurposed debugger for Microsoft Windows, distributed on the web by Microsoft as part of the Debugging Tools for Windows. It can be used to debug user mode applications, drivers, and the operating system itself in kernel mode' and is an app in the Development category. There are more than 10 alternatives to WinDbg for a variety of platforms, including Windows, Mac, Linux, Online / Web-based and.NET Framework. The best alternative is Microsoft Visual Studio. It's not free, so if you're looking for a free alternative, you could try x64dbg or OllyDbg. Other great apps like WinDbg are IDA (Paid), B4X (Freemium), React Studio (Freemium) and Microsoft Small Basic (Free).
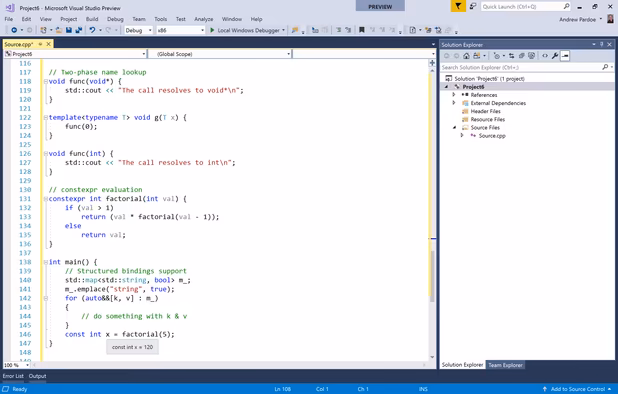
- Microsoft Visual Studio is an integrated development environment (IDE) from Microsoft. It is used to develop computer programs for Microsoft Windows, as well as web sites, web applications and web services.
- Free Personal • Proprietary
- Mac
- Windows
- Online
- .NET Framework
- x64dbg is a 64-bit assembler-level debugger for Windows. The corresponding 32-bit debugger is called x32dbg.
- The IDA Pro Disassembler and debugger is a multi-processor disassembler and debugger hosted on the Windows, Linux and Mac OS X Platforms.
- OllyDbg is a 32-bit assembler level analysing debugger. Emphasis on binary code analysis makes it particularly useful in cases where source is unavailable.
Discontinued
The program is no longer updated. Last version, 2.01, released in September 2013, can be still downloaded from the official website.
- Cross platform development tools for native iOS, Android, desktop and server applications. B4X is a Rapid Application Development (RAD) tool for real world apps. The programming language is a modern version of Visual Basic.
- Freemium • Proprietary
- Windows
- Android
- iPhone
- Android Tablet
- iPad
- React Studio lets you create components either visually or in code, then use them interchangeably in your designs.
- Microsoft Small Basic puts the fun back into computer programming. With a friendly development environment that is very easy to master, it eases both kids and adults into the world of programming.
- The C++ IDE for professional developers.
- The Debug Diagnostic Tool (DebugDiag) is designed to assist in troubleshooting issues such as hangs, slow performance, memory leaks or memory fragmentation, and crashes in any user-mode process.No screenshots yet
- A very powerful, versatile, and customizable Win32/Win64 user mode debugger/disassembler. PEBrowseDbg64 Interactive is not a source code debugger, but operates at the Intel x64 instruction level and therefore at the lowest level where your program executes.