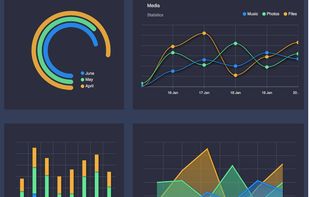
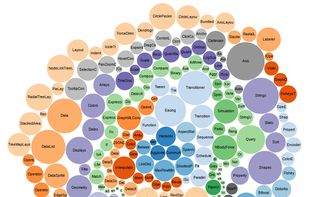
D3.js is a JavaScript library for manipulating documents based on data. D3 helps you bring data to life using HTML, SVG, and CSS.
Cost / License
- Free
- Open Source
Application type
Platforms
- Online
- Self-Hosted
 United States




+6





Apps similar to Wick Charts include D3.js, which is free and open source. Other options are Plotly, Chart.js, Highcharts and CanvasJS Charts. You can choose from more than 10 Charting Library Tools like Wick Charts for the web, self-hosting, iPhone, Mac and Windows.
D3.js is a JavaScript library for manipulating documents based on data. D3 helps you bring data to life using HTML, SVG, and CSS.
United States
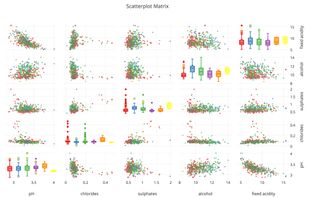
Plotly is the easiest way to graph and share data online. Open-source libraries for JavaScript (comparison with HighCharts at https://plot.ly/highcharts-alternative/), Python, R, and MATLAB.
United States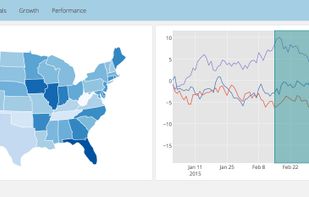
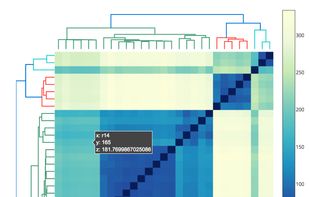


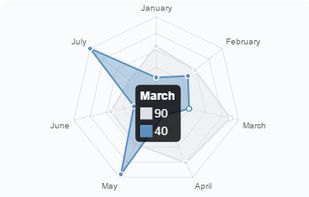
Easy, object oriented client side graphs for designers and developers. Open source HTML5 charts using the canvas tag. Chart.js is an easy way to include animated graphs on your website.


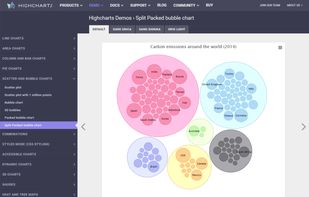
Highcharts is a charting library written in pure JavaScript, offering an easy way of adding interactive charts to your web site or web application. Highcharts currently supports line, spline, area, areaspline, column, bar, pie and scatter chart types.
 Norway


CanvasJS is an easy to use HTML5 and Javascript Charting library. It runs across devices including iPhone, iPad, Android, Windows Phone, Microsoft Surface, Desktops, etc. This allows you to create rich dashboards that work on all the devices without compromising on...
 India
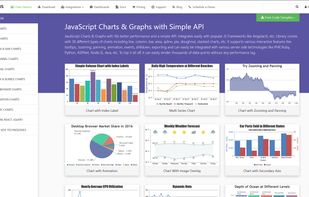
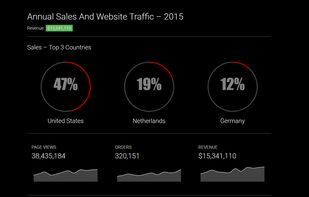


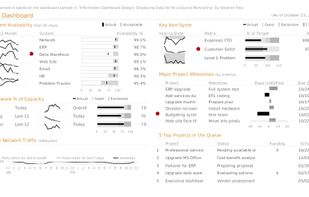
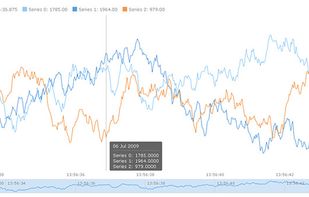
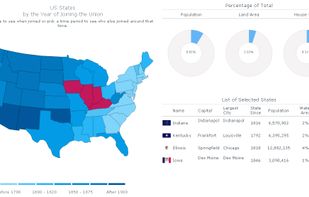
Flexible, cross-platform and cross-browser JavaScript (HTML5) charting library that allows you to create interactive bar, pie, line, spline, area, Gantt, stock and other charts, maps and dashboards, with real-time updates and multi-level drill-downs.
United States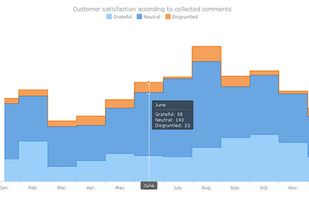


amCharts is an advanced charting library that will suit any data visualization need. Our charting solution include Column, Bar, Line, Area, Step, Step without risers, Smoothed line, Candlestick, OHLC, Pie/Donut, Radar/ Polar, XY/Scatter/Bubble, Bullet, Funnel/Pyramid charts as...
United States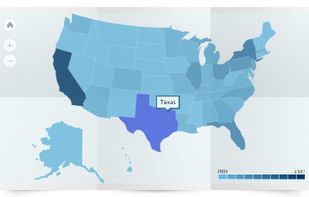
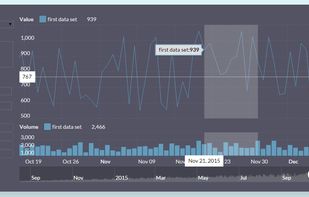


ECharts is an open-sourced JavaScript visualization tool, which can run fluently on PC and mobile devices. It is compatible with most modern Web Browsers, e.g., IE8/9/10/11, Chrome, Firefox, Safari and so on.

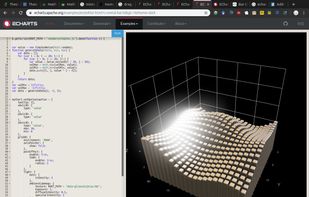


ApexCharts.js - An open-source HTML5 JavaScript charting library that helps developers to create responsive & interactive JS charts for web pages.
India