




Wick Charts
1 like
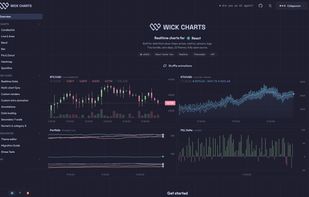
Wick Charts is an open-source chart library for live data. Its canvas engine streams candlestick, line, area, bar, band, heatmap and pie series at 60fps and animates every update: new ticks, zoom, pan and history loads.

Cost / License
- Free
- Open Source (MIT)
Platforms
- React
- JavaScript
- Vue.js



Features
Highlights All activities
Wick Charts News & Activities
Recent activities
- mo4islona liked Wick Charts
- mo4islona updated Wick Charts
- mo4islona added Wick Charts
 mo4islona added Wick Charts as alternative to Chart.js, D3.js, CanvasJS Charts, AnyChart and 9 more

Developed by
Evgeny FormanenkoLicensing
Open Source (MIT) and Free product.Written in
Alternatives
13 alternatives listedBadge
Get an embeddable badge for Wick ChartsSupported Languages

AlternativeTo Category
DevelopmentGitHub repository
- 6 Stars
- 0 Forks
- 24 Open Issues
- Updated


No comments or reviews, maybe you want to be first?