


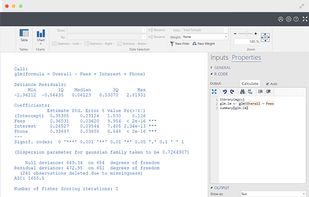
STATISTICA is a tried and true analytics platform with more than two decades of history in delivering successful business results for our customers, a global user base of more than 600,000 users.
Cost / License
- Paid
- Proprietary
 United States
Platforms
- Windows


TRTT is described as 'Statistical analysis application that opens, edits and saves SPSS .sav and .zsav data files. It runs as a web app in the browser, with all computation done client-side via WebAssembly, and as a native iPhone/iPad app that shares the same analysis engine, so results are' and is a statistical analyzer in the development category. There are more than 50 alternatives to TRTT for a variety of platforms, including Windows, Linux, Mac, Web-based and Android apps. The best TRTT alternative is R (programming language), which is both free and Open Source. Other great apps like TRTT are RStudio, PSPP, JASP and Positron.
STATISTICA is a tried and true analytics platform with more than two decades of history in delivering successful business results for our customers, a global user base of more than 600,000 users.

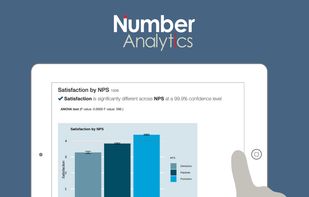
Number Analytics is an web based statistical software for academics and market research supporting various types of data (SPSS, Excel, CSV, STATA, Minitab, SAS) and platforms (iOS, Android, and Web).


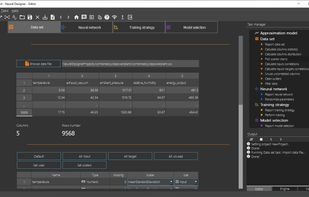
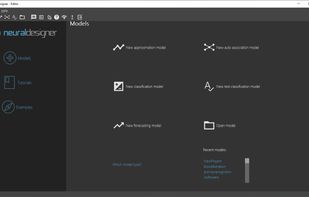
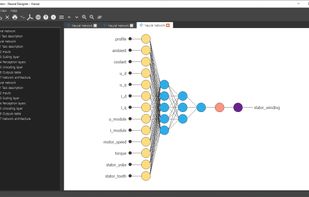
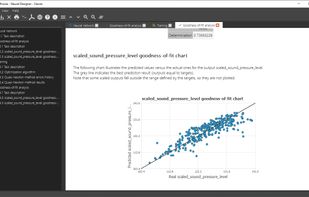
Neural Designer is a software tool for advanced analytics. It includes tools for descriptive, diagnostic, predictive and prescriptive analytics. It allows you to get actionable insights resulting in smarter decisions and better business outcomes.


SAS is the leader in business analytics software and services, and the largest independent vendor in the business intelligence market.


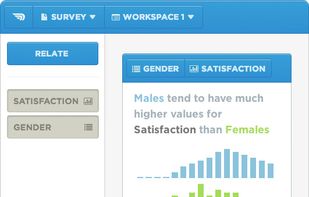
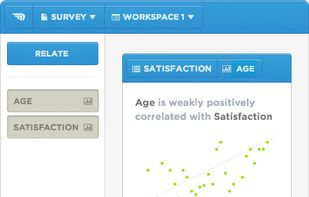
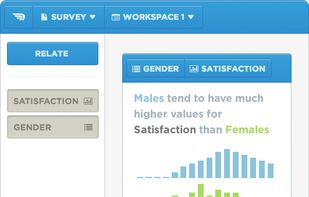
Statwing was built by and for analysts, so you can clean data, explore relationships, and create charts in minutes instead of hours. Simply upload your spreadsheet or dataset, then select the relationships you want to explore.
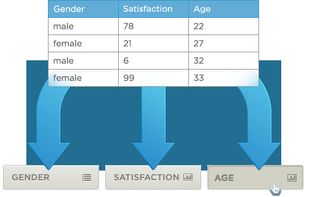


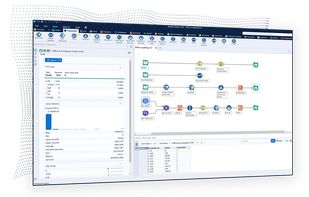
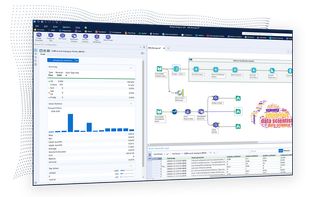
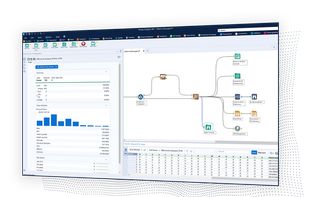
Automates every step of analytics, offering drag-and-drop data blending, text mining with OCR and NLP, insights enrichment, and integration with 70+ apps. Connect workflows with RPA and process intelligence systems for deeper insights and process automation breakthroughs.



Revolution Analytics provide commercial support and software for the open source R - the world's most powerful statistics software.
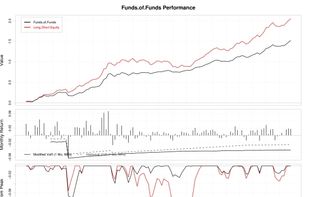


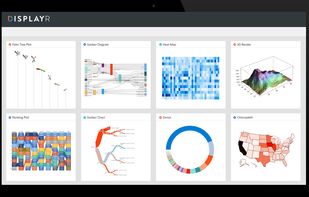
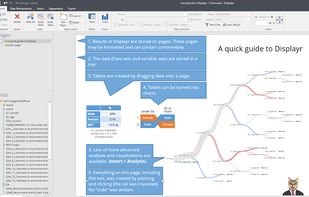
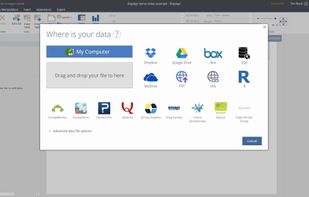
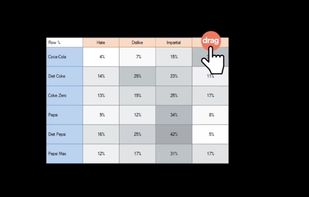
Displayr is online data science and data analytics software. It was created so smart people could do their own data science: explore, model, visualize and report. One app for everything. Easy for novices, powerful for experts.


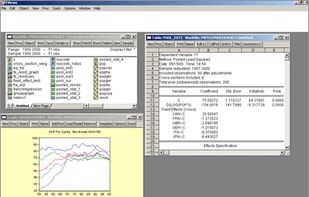
EViews (Econometric Views) is a statistical package for Windows, used mainly for time-series oriented econometric analysis.



SHAZAM is a comprehensive computer program for econometricians, statisticians, biometricians, sociometricians, psychometricians, politicometricians and others who use statistical techniques.

Very cheap software (you pay for a three year licence) and very easy to use, as it is based on a spreadsheet. Indeed, it is possible to copy and paste data between Excel and StatsDirect. Also, for those who are not well-versed in statistics, there is an inexpensive book by Cole...


For novice to expert market researchers, Q quickly turns survey data into smart insights, beautiful visualizations and clever reports, using the most advanced analysis techniques. Use menus or code to do the most advanced analyses; while smart systems and automated...


 Spain
Spain EU
EU


 Australia


 United Kingdom


