


Cube.js is an analytics layer for modern applications. It supplies building blocks to add analytics features into any application you create. Cube.js is designed to work with large-scale data sets and implements various optimization techniques.


The best free alternative to Tableau is Grafana, which is also Open Source. If that doesn't suit you, our users have ranked more than 100 alternatives to Tableau and loads of them is free so hopefully you can find a suitable replacement. Other interesting free alternatives to Tableau are GridCraft, Metabase, Microsoft Power BI and Gephi.
Cube.js is an analytics layer for modern applications. It supplies building blocks to add analytics features into any application you create. Cube.js is designed to work with large-scale data sets and implements various optimization techniques.

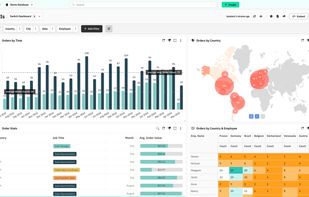
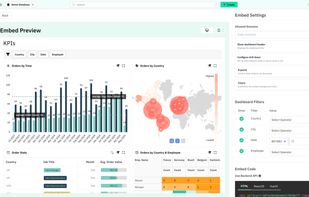
Business Intelligence (BI) analytics platform to build up graphical dashboard with charts, based on the data, gathered from different sources.
 United Kingdom

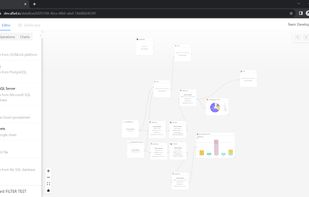

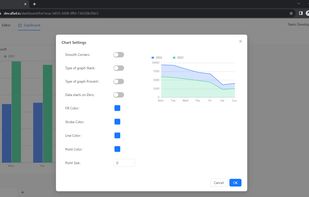


Analyze and Monitor SQL Database. Explore Data with Query Builder, Visualise Data, Build Custom Dashboard and get Alerts for Data changes via Slack and Email.
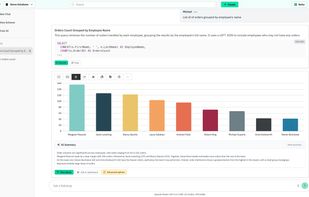
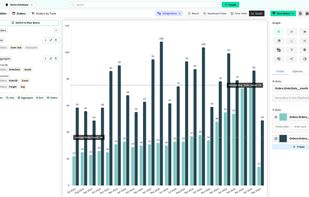


SolidSheets offers a user-friendly interface and powerful features to manage and analyze your data. Easily open, edit, and print CSV, SSFS/SSFS64, and XLSX files. With advanced formulas, charts, and machine learning algorithms, accelerate your workflow.
 Türkiye


 United Kingdom



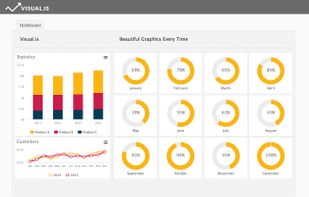
Visual.is was founded on the belief that by maximizing the visual impact of your data, you can transform your business. We are experienced designers and programmers who believe in the value of beautiful information design.
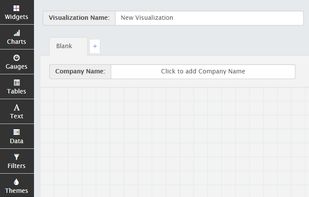


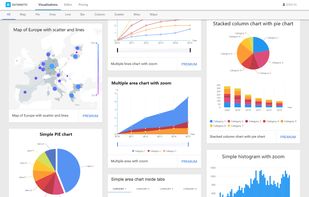
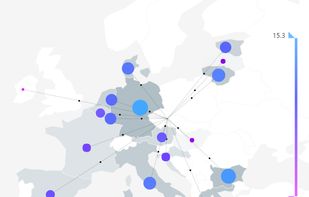
Datamatic is like WordPress for data visualizations, it offers 70+ interactive data visualization templates, Excel-like data editor & beautiful material design styles. Data visualizations can be easily embedded in any website or web application.
 Czechia
 EU
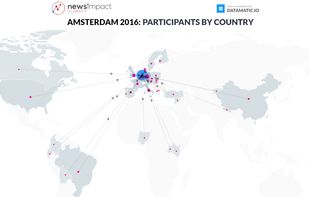
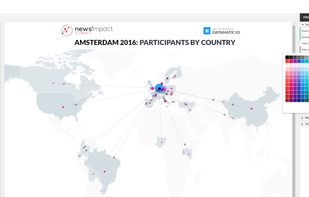

 United Kingdom
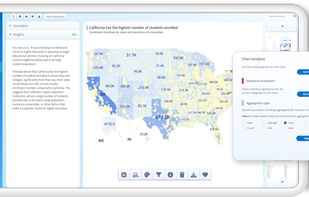


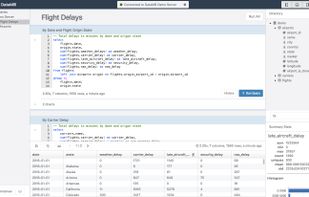
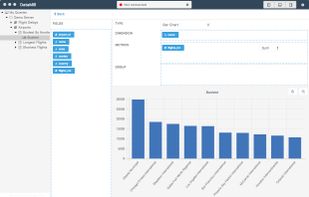
DataMill is an app that helps you write, organize, analyze and share SQL queries. It includes an advanced editor featuring full autocomplete and snippets, instant query result summaries, query and result history, and built-in charting.


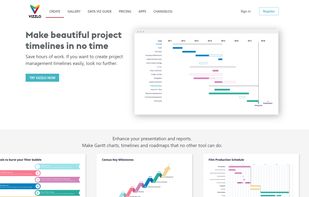
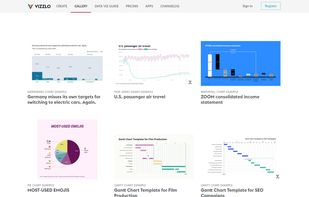
Vizzlo is a browser-based tool to create professionally designed charts, graphics, and business visualizations in just a few seconds. Preparing high-quality visual aids for presentations can be time intensive, and results are usually not satisfactory.
 GermanyEU



 United States


