


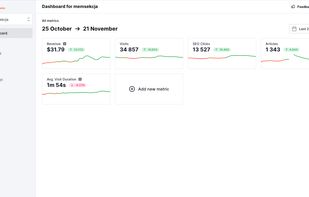
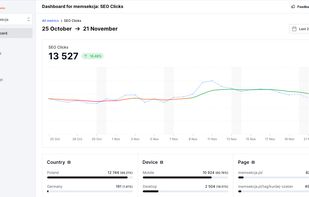
Raport allows you to analyze all your data in one app, delivers recurring reports and alerts you about critical events.
Cost / License
- Free
- Proprietary
Since
- Since 2021





One of the most popular alternatives to Microsoft Power BI is Metabase, which is open source with a free version. Other popular alternatives are Tableau, Redash, JasperReports and Pentaho. You're spoiled for choice with Business Intelligence Tools like Microsoft Power BI: we list more than 100 alternatives for the web, Windows, self-hosting, Mac and Linux.
Raport allows you to analyze all your data in one app, delivers recurring reports and alerts you about critical events.

Gridarrow is the missing server for Excel. We host and run Python scripts that connect to your data and send it to Excel in real-time.
 Netherlands
 EU


EzDataMunch helps companies drive their business by providing insight and access into critical data, KPIs, and metrics with a user-friendly and cost-effective enterprise dashboard applications.
 United States


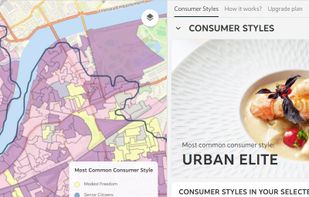
Spotzi is an easy-to-use online geomarketing platform you can try for FREE. Spotzi has a short learning curve, so you don't have to be a data scientist to work with Spotzi. Our main goal is to find your best-fit customers in just a few clicks.
NetherlandsEU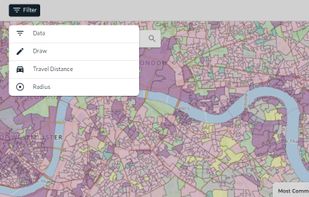
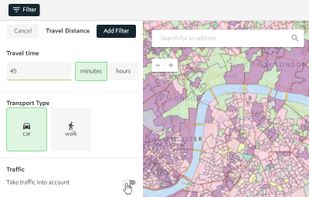



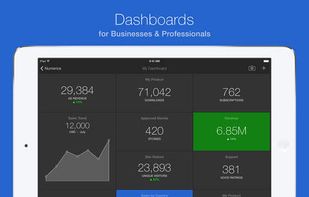
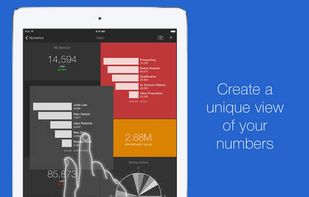
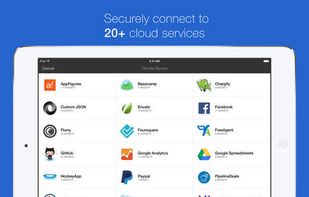
Visualize all your vital business statistics, live, in one place. Numerics helps you know your numbers, focus on your goals and make better decisions.
 India



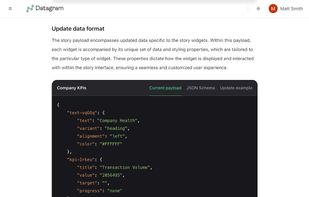
Datagram helps software developers easily share key metrics with their teams via a mobile app and API.
United States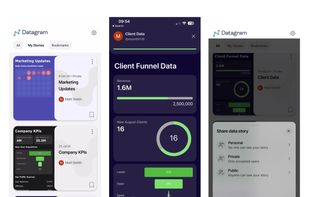


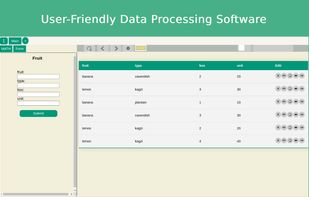
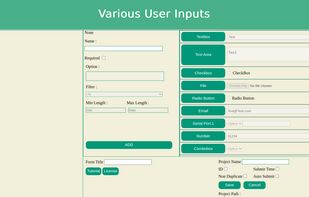
Data processing software with a simple GUI, and has many types of input (text, numbers, serial communication, etc.) and output (graphs, tables, serial communication, etc.). Suitable for analyzing and visualizing data.

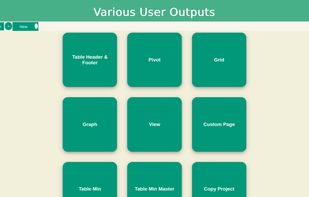


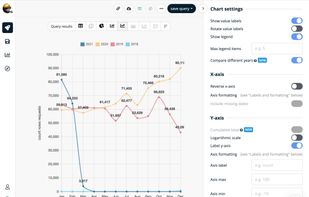
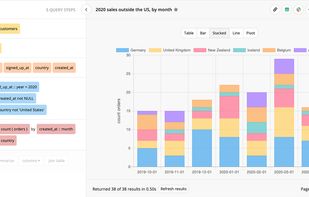
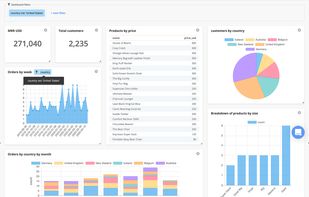
Trevor.io replaces data requests inside your company, empowering your whole team to get answers from your database data in just a few clicks.
 GermanyEU


Flookup is a Google Sheets add-on that uses the power of fuzzy matching for data cleaning.


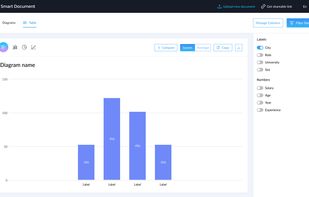
Smart Documents helps to understand the data without training. Just upload your table in "XLS" or "CSV" formats, filter the data and build a visualization.


 United Kingdom


