SciChart provides GPU-accelerated chart libraries for demanding business, scientific, medical & financial applications on multiple platforms including JavaScript, iOS, Android, macOS and Windows Presentation Foundation.
 United Kingdom
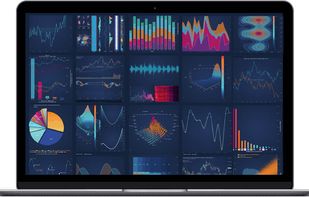


Apps similar to Plotly include D3.js, which is free and open source. Other options are Tableau, Matplotlib, RAWGraphs and Apache Echarts. Charting Library Tools like Plotly are a crowded field, with more than 100 alternatives for the web, Windows, Mac, self-hosting and Linux.
SciChart provides GPU-accelerated chart libraries for demanding business, scientific, medical & financial applications on multiple platforms including JavaScript, iOS, Android, macOS and Windows Presentation Foundation.
United Kingdom
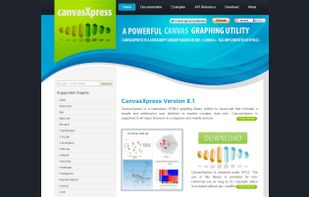
CanvasXpress is a standalone HTML5 graphing library written in Javascript that includes a simple and unobtrusive user interfase to explore complex data sets.


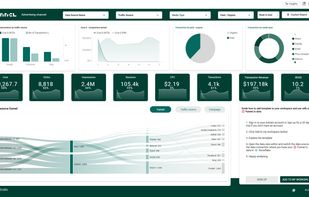
bipp is an enterprise-grade cloud, business intelligence platform. We help data analysts create faster queries & deliver sharper insights.


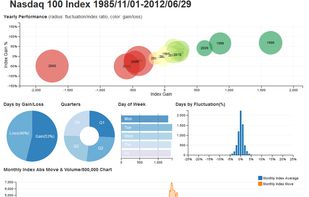
dc.js is a JavaScript charting library with native Crossfilter support and allowing highly efficient exploration on large multi-dimensional dataset (inspired by Crossfilter 's demo). It leverages d3 engine to render charts in CSS friendly SVG format. Charts rendered using dc.
 United States


A general purpose real-time charting library for building beautiful, smooth, and high performance visualizations.


Astrato brings true Self-Service BI to Enterprises & Data Businesses by putting analytics in the hands of every user, enabling them to build their own dashboards, reports and data apps.
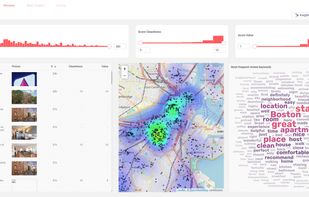




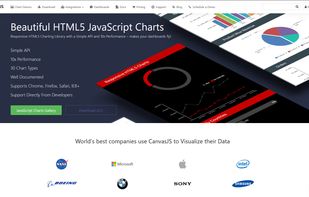
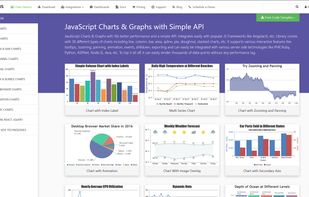
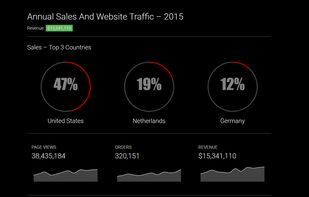
CanvasJS is an easy to use HTML5 and Javascript Charting library. It runs across devices including iPhone, iPad, Android, Windows Phone, Microsoft Surface, Desktops, etc. This allows you to create rich dashboards that work on all the devices without compromising on...
 India



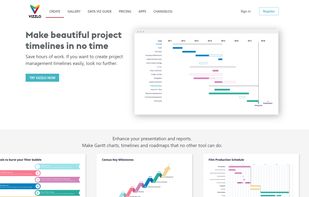
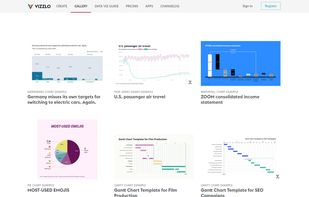
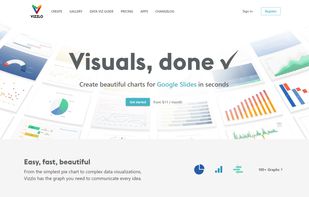
Vizzlo is a browser-based tool to create professionally designed charts, graphics, and business visualizations in just a few seconds. Preparing high-quality visual aids for presentations can be time intensive, and results are usually not satisfactory.
 Germany
 EU



The Syncfusion JavaScript UI controls library is the only suite that you will ever need to build an application since it contains over 60 high-performance, lightweight, modular, and responsive UI components in a single package.
United States
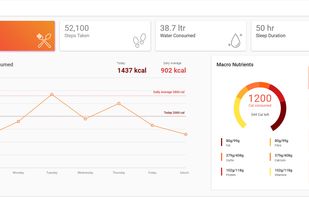
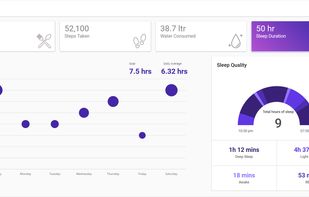

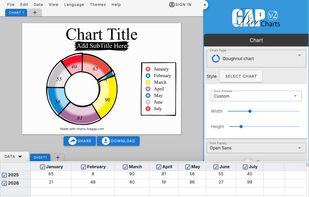
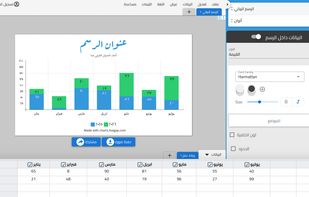
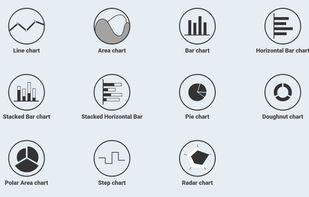
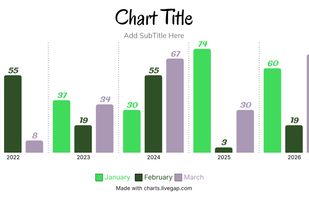
Livegap Charts is a fast, easy-to-use online tool for creating beautiful charts and data visualizations directly in your browser. No downloads, installations, or subscriptions are required—just open your browser and start designing.
 Egypt