


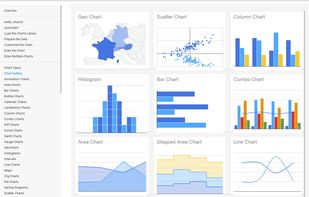
The Google Charts is an extremely simple tool that lets you easily create a chart from some data and embed it in a webpage. You embed the data and formatting parameters in an HTTP request, and Google returns a PNG image of the chart.
 United States


Apps similar to Plotly include D3.js, which is free and open source. Other options are Tableau, Matplotlib, RAWGraphs and Apache Echarts. Charting Library Tools like Plotly are a crowded field, with more than 100 alternatives for the web, Windows, Mac, self-hosting and Linux.
The Google Charts is an extremely simple tool that lets you easily create a chart from some data and embed it in a webpage. You embed the data and formatting parameters in an HTTP request, and Google returns a PNG image of the chart.
United States
The world's most interactive data visualization software. Supercharged touch-screen enabled HTML5 Graph and Chart library, written in fast cross-platform JavaScript, runs in all browsers.
 Latvia
 EU


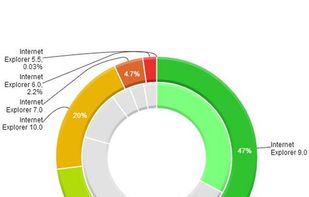
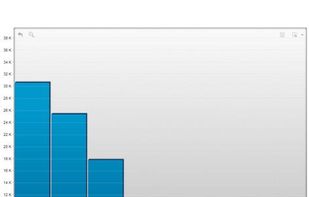


amCharts is an advanced charting library that will suit any data visualization need. Our charting solution include Column, Bar, Line, Area, Step, Step without risers, Smoothed line, Candlestick, OHLC, Pie/Donut, Radar/ Polar, XY/Scatter/Bubble, Bullet, Funnel/Pyramid charts as...
United States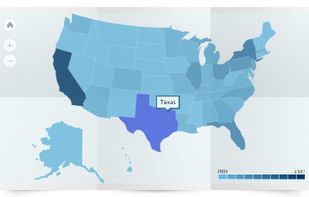
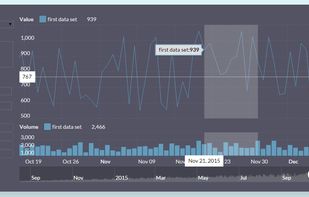


Business Intelligence and Data Analytics software that configures itself, using Artificial Intelligence instead of data experts.


BIME allows you to connect to both the online and the on-premise world in the same place. Create connections to all your data sources, create and execute queries and view your dashboards easily - all within BIME's beautifully intuitive interface.


FusionCharts Suite XT helps you create interactive JavaScript charts, gauges and maps in a jiffy for all your web, mobile and enterprise applications. Using it, you can build awesome dashboards, reports, analytics, monitors, surveys that blend aesthetic elegance and actionable...
 United Kingdom
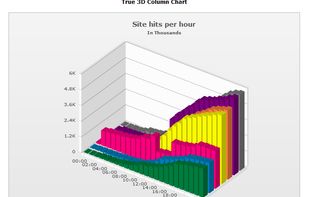
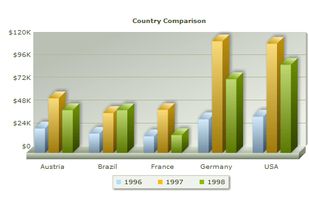


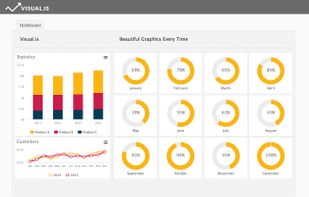
Visual.is was founded on the belief that by maximizing the visual impact of your data, you can transform your business. We are experienced designers and programmers who believe in the value of beautiful information design.
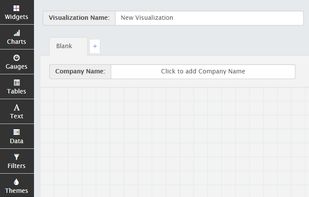


Pretzel is an open-source, offline browser-based tool for fast and intuitive data exploration and visualization. It can handle large data files, runs locally in your browser, and requires no backend setup.
United States


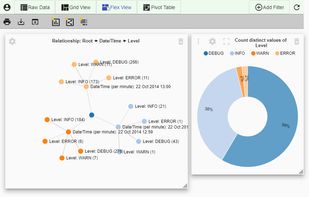
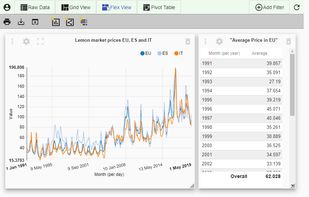
Create graphs online with CSV, Excel or JSON data. Choose from different chart types, pivot tables and relationship graphs. Easy, user-friendly, open- source.
 Switzerland


Looker gives you access to your organization’s data. Many users start by browsing through the reports - which we call “Looks” - and dashboards that others in their organization have already created. This page will show you how to get started browsing.
United States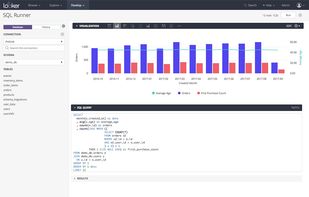


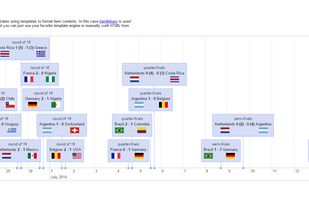
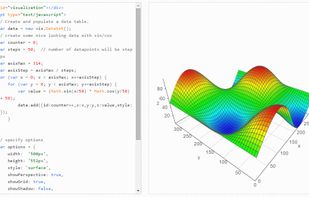
vis.js is a dynamic, browser based visualization library. The library is designed to be easy to use, to handle large amounts of dynamic data, and to enable manipulation of and interaction with the data.
 NetherlandsEU


 France


