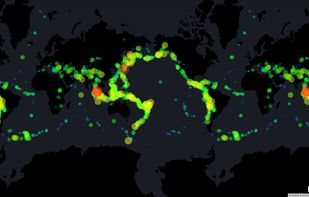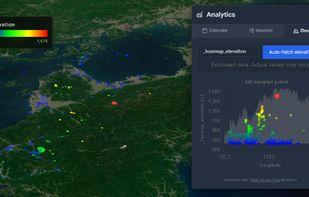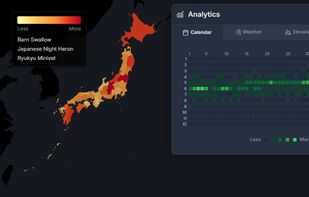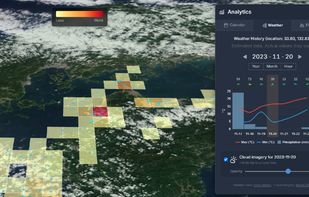


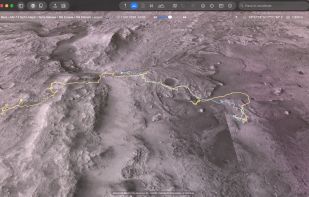
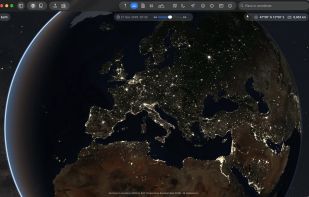
Explore Earth from space to sea with detailed satellite imagery, 3D buildings, and ad-free service. Save toured places, share them, and explore offline all points of interest around the globe.
 United States
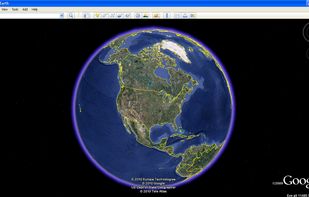

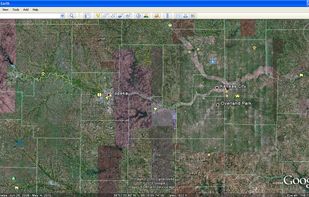

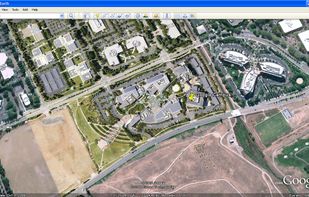





Apps similar to Plenum Globe include Google Earth, which is free for personal use. Other options are Tableau, Microsoft Power BI, Kugelblitz and NASA World Wind. You can choose from more than 10 Map Services like Plenum Globe for the web, Mac, Windows, Linux and self-hosting.
Explore Earth from space to sea with detailed satellite imagery, 3D buildings, and ad-free service. Save toured places, share them, and explore offline all points of interest around the globe.
United States
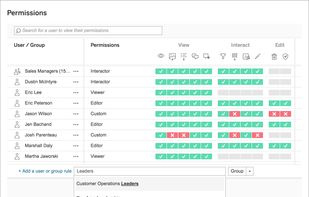
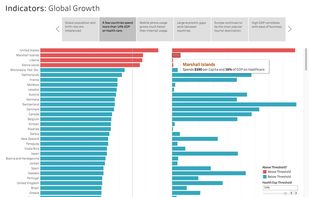
Tableau helps the world’s largest organizations unleash the power of their most valuable assets: their data and their people.
United States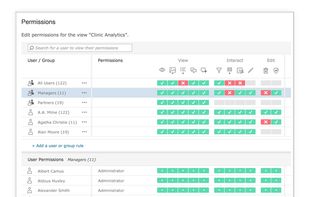
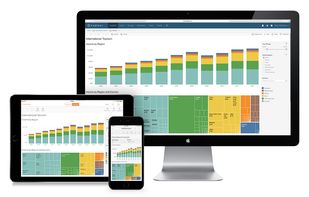


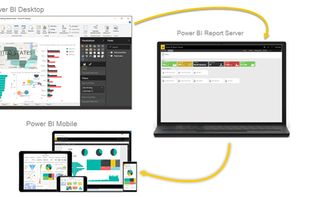
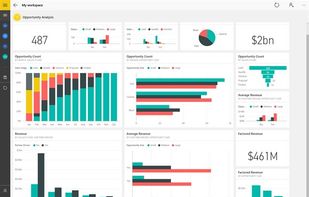
Utilize Microsoft's Power BI to convert varied data sources into interactive visual insights. It includes Power BI Desktop, online services, and mobile apps, allowing the creation, sharing, and consumption of business insights on any device, tailored to diverse business needs.
United States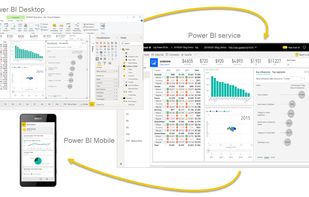



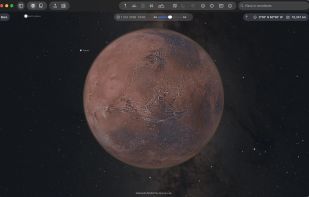
The Earth and its neighbors as a 3D globe and atlas for the Mac – maps and open geodata on real terrain.
 Germany
 EU
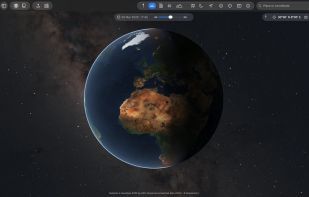


World Wind lets you zoom from satellite altitude into any place on Earth. Leveraging Landsat satellite imagery and Shuttle Radar Topography Mission data, World Wind lets you experience Earth terrain in visually rich 3D, just as if you were really there.
United States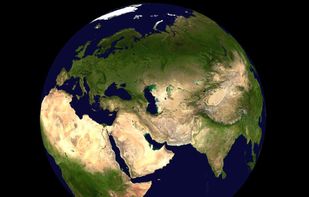
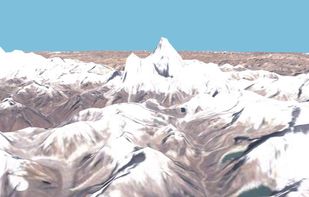
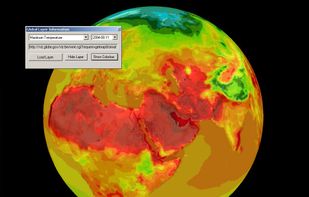

Marble is a Virtual Globe and World Atlas that you can use to learn more about Earth: You can pan and zoom around and you can look up places and roads. A mouse click on a place label will provide the respective Wikipedia article.
GermanyEU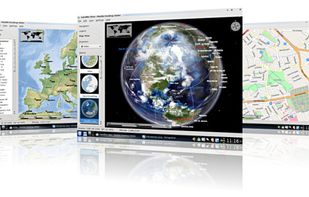

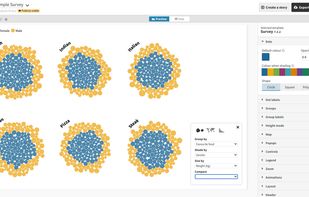
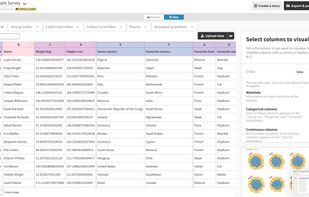
A visualization suite, to turn spreadsheets into charts, maps, and interactive stories.
 United Kingdom


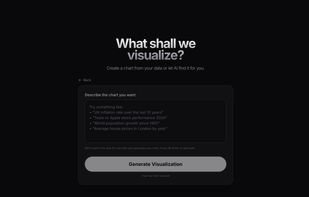
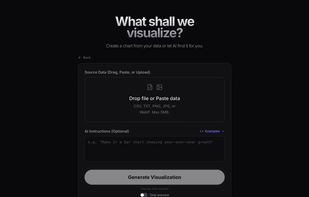
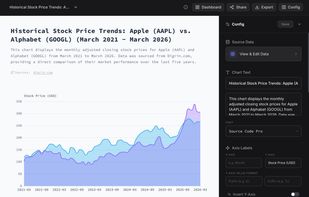
AI-powered chart generator that creates visualizations from natural language. Searches the web for real data, converts screenshots to editable charts, and exports publication-ready graphics.
United Kingdom


Advanced chart maker for business presentations. Build Waterfall, Mekko, Pareto, Stacked Column, Bubble and more from spreadsheets or AI prompts.
 India
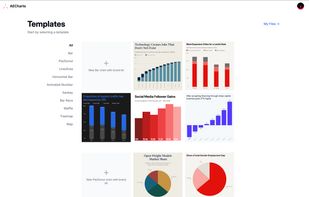
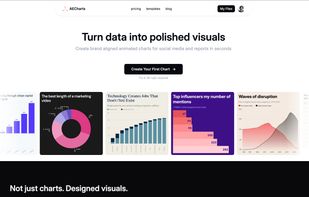
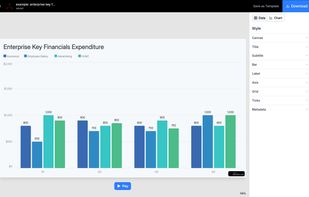
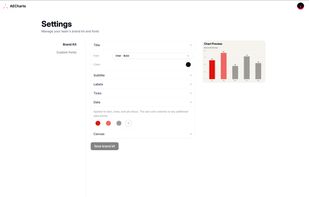


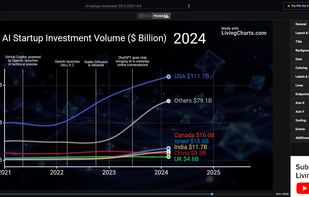
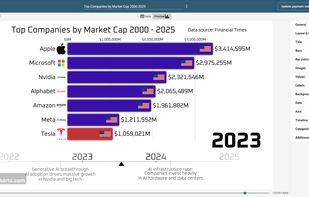
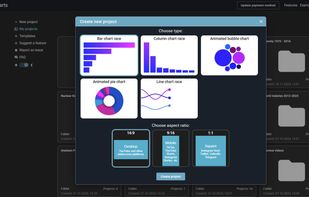
Create animated charts and bar chart race videos online. Import your data, customize visuals, and export high-quality videos in minutes.
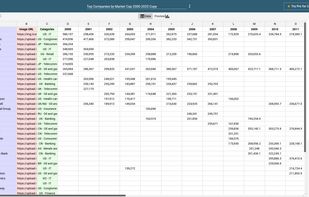


HooMap is a browser-based tool designed to transform CSV and Excel coordinate data into interactive maps in seconds. Built for researchers, students, and data enthusiasts, it allows you to visualize spatial data directly in your workflow without the need for complex GIS software...