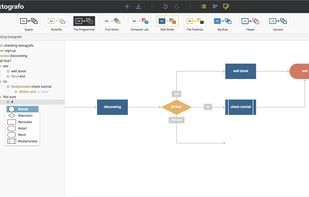
Graphity is a diagram editor that can be used to quickly and effectively generate drawings and to apply automatic layouts to a range of different diagrams and networks.
Cost / License
- Free
- Proprietary
Application type
Platforms
- Online
 Germany
 EU


Apps similar to PlantText include draw.io, which is free and open source. Other options are LibreOffice - Draw, Dia, yEd Graph Editor and Lucidchart. There's no shortage of Diagram Editors like PlantText, with more than 50 alternatives for Windows, the web, Mac, Linux and Android.
Graphity is a diagram editor that can be used to quickly and effectively generate drawings and to apply automatic layouts to a range of different diagrams and networks.
GermanyEU
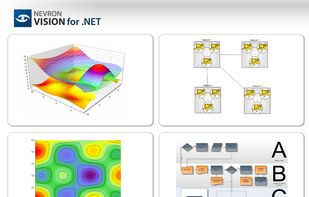
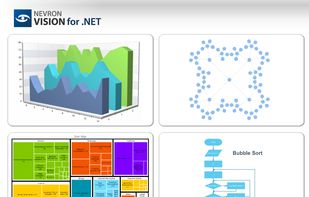
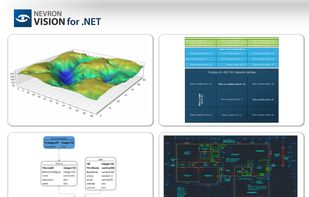
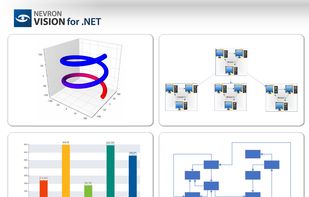
Nevron Vision for .NET provides a complete set of components for data visualization that integrate with WinForms, Wpf, ASP.NET, and MVC applications.
 BulgariaEU


ClassBuilder is freeware CASE tool targeted at the C++ developer, running on Win2K-XP. It lets you create, manipulate and navigate classes, class relations, class members and class methods at a high level of abstraction through a graphical user interface.


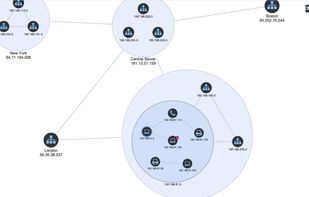
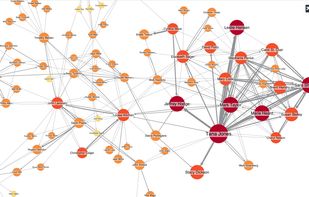
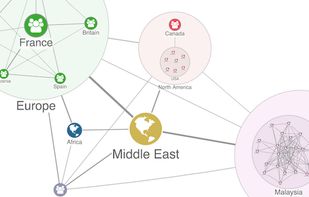
KeyLines is a JavaScript toolkit used by developers to build powerful network visualization applications, quickly.
 United Kingdom


BOUML is a free UML 2 tool box (under development) allowing you to specify and generate code in C++, Java, Idl, Php and Python.
 FranceEU


Cubetto gives you the opportunity to model in modeling languages from a vast set of selections. You can choose between BPMN, Event-driven Process Chains (EPC) to Flowcharts. Even a generic modeling language for your own needs is available.
GermanyEU


the Chronos Web Modeller is a collaborative tool for the creation of UML models with reporting, code and document generator .


A lightweight HTML5/javascript library for UML 2 diagramming.
Alpha software. This project is in progress. Many functionalities are ready to be used. Nevertheless, some features and developments will not be neccessarily available for download.


GenMyModel is an online modeling plateforme for UML, BPMN2, Database, Flowchart and more. It supports realtime collaboration, centralized model repository, versioning and full traceability.
FranceEU


The GoVisual Diagram editor (GDE) provides powerful functionality for editing and automatic layout of diagrams. Diagrams are represented in form of graphs and cluster graphs. GDE contains all the layout styles available in the GoVisual libraries.


Generate diagrams from text faster than ever and facilitate stakeholders involvement via animation and online collaboration.