Like WinMTR or mtr, it discovers every router between you and a target, then re-probes the whole path on an interval. Each round is effectively a full traceroute, so you accumulate min / avg / max / current latency, jitter, and packet loss for every hop over time — which makes it obvious where along the path a problem lives (your LAN, your ISP's first hop, a peering point, or the destination).
• Route discovery by walking the IP TTL upward and reading the "TTL exceeded" replies (standard traceroute primitive).
• Continuous monitoring of all hops, fanned out across a small thread pool so each round takes ~one timeout, not the sum.
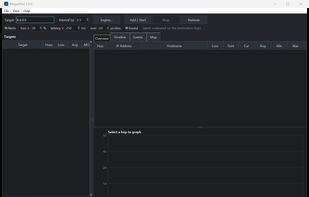
• Live hop table — IP, reverse-DNS hostname, loss %, sent count, current/avg/min/max latency, jitter. Rows colour amber/red on loss or high latency.
• Single-hop latency graph (Overview tab) for the selected hop (click a row), with red ticks marking lost probes and a filled area for the trend.
• All-hops timeline (Timeline tab) — every hop drawn as a stacked strip on a shared time + latency scale, so a latency step shows up as the row where the bars get tall. This is the full MTR-style path-over-time view.
• Continuous auto-retrace + route-change detection — because every round is a full traceroute, reroutes (a hop's address changing) and route length grow/shrink are detected live and written to the Events tab.
• Sustained-degradation alerts — a red banner + Windows beep + Event-log entry when the destination shows sustained packet loss or high latency over the last N probes. Evaluated on the destination only (the one hop whose numbers aren't muddied by ICMP-deprioritising routers), and gated so a target that simply blocks ICMP never false-alarms.
• ICMP / TCP / UDP probe modes — trace with ICMP (default, no admin), or TCP SYN to a port / UDP, for paths that block ICMP or to test a specific service. See Probe modes for the admin tradeoffs.
• Multi-target — monitor many targets at once; a left summary grid shows each one's hop count, loss, latency, and MOS at a glance. Click one to drive the detail tabs. Alerts on any target surface in the banner.
• MOS (VoIP quality) score for the destination — one number (ITU-T E-model) for "is this path good enough for voice/video", shown live in the status bar.
• Per-target settings — engine and alert options are remembered per target; right-click a target → Edit settings… to inspect or change just that one.
• Webhook alerts — point the Engine dialog's Webhook URL at an http(s) endpoint to get a JSON POST when the destination alert raises or clears.
• DSCP marking — probe as the traffic class you care about (46 = EF/voice, 34 = AF41/video) instead of always as best-effort, so a QoS-marked path can be measured as itself. See DSCP and source interface.
• MOS alerts — alert on the score itself, not just loss and latency separately. The E-model folds latency, jitter and loss together, so a path can sit under every individual threshold and still be unusable for voice.








 nova89 added PingerPlot as alternative to WinMTR, Tracebar, PingPlotter, Trippy and 4 more


No comments or reviews, maybe you want to be first?