


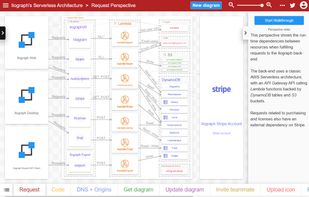
With Ilograph diagrams, you define your resources once, then show how they're related from many different perspectives. Seamlessly change perspectives to demonstrate cross-functional dependencies and shared responsibilities.


Apps similar to Penrose include draw.io, which is free and open source. Other options are LibreOffice - Draw, yEd Graph Editor, Microsoft Visio and PlantUML. Diagram Editors like Penrose are a crowded field, with more than 50 alternatives for Windows, Mac, the web, Linux and self-hosting.
With Ilograph diagrams, you define your resources once, then show how they're related from many different perspectives. Seamlessly change perspectives to demonstrate cross-functional dependencies and shared responsibilities.

yFiles for HTML is a modern JavaScript graph visualization toolkit for creating, editing, viewing, and automatically arranging graphs, diagrams, and networks.


Create weighted and unweighted graphs and run algorithms step by step. Learn graph theory interactively… much better than a book!.


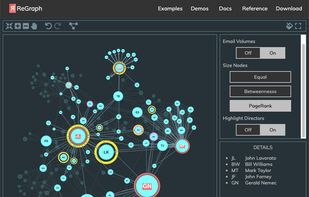
ReGraph is a React toolkit for developers to add powerful, interactive graph data visualizations to their applications quickly and easily.
 United Kingdom


A simple way of describing graphs and include it easily in your web for free, blog, markdown page, github, and any location where remote images can be showed.



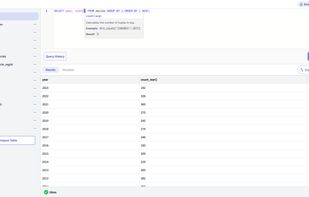
TextQuery is a desktop app that lets you import data file as a table, query it using SQL, and create stunning charts from those results.


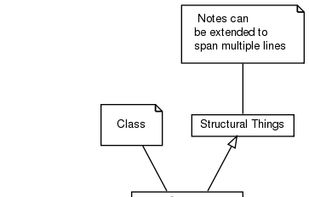
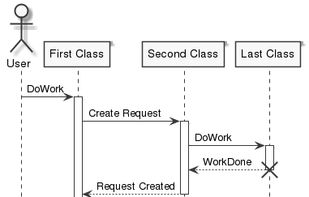
Flowdia is an easy to use flow diagram tool that can be used to quickly create professional quality Flow Charts, BPMN 2.0 diagrams, Network Layouts, UML Activity and Class diagrams.


