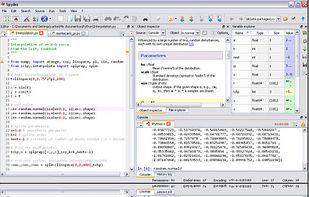
Python(x,y) is a free scientific and engineering development software for numerical computations, data analysis and data visualization based on Python programming language, Qt graphical user interfaces and .
 France
 EU


Apps similar to OriginPro include Matplotlib, which is open source with a free version. Other options are GnuPlot, LabPlot, Plotly and Minitab. There's no shortage of Statistical Analyzers like OriginPro, with more than 50 alternatives for Windows, Mac, Linux, the web and iPhone.
Python(x,y) is a free scientific and engineering development software for numerical computations, data analysis and data visualization based on Python programming language, Qt graphical user interfaces and .
FranceEU
Alpha Plot is a free application for Scientific Data Analysis and Visualization for Windows, Linux and Mac OS X. It is a fork of scidavis under active development.


Open source framework for numerical computations and advanced statistical analysis, featuring nonlinear curve fitting, ODE solving, 1D/2D publication-quality visualization, Fourier and wavelet transforms, intuitive syntax, and namespace-based code organization for research.
 GermanyEU


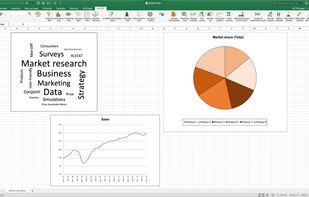
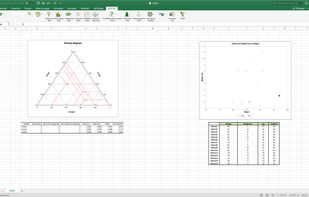
XLSTAT is a powerful yet flexible Excel data analysis add-on that allows users to analyze, customize and share results within Microsoft Excel.
FranceEU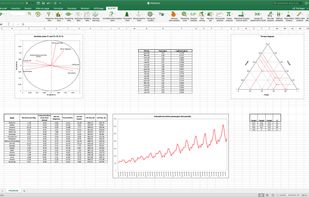
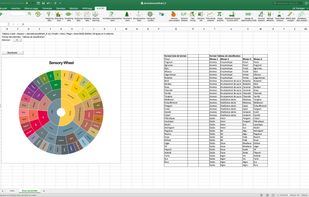


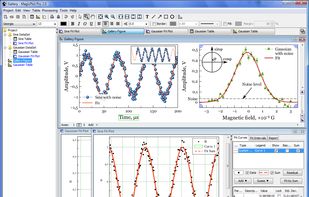
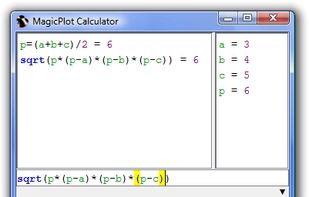
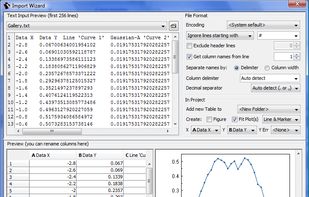
MagicPlot is cross-platform application for scientific and engineering plotting, non-linear and multipeak curve fitting and batch processing. MagicPlot produces high-quality plots and offers handy plot navigation. Project files have .mppz extention.
 United States



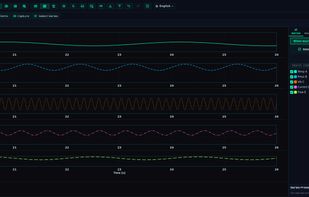
LOGADEC is time-series visualization and analysis software that runs in your web browser from a single HTML file. It needs no installation or administrator rights and makes no network connections while running, so it works on isolated test benches and locked-down corporate PCs...


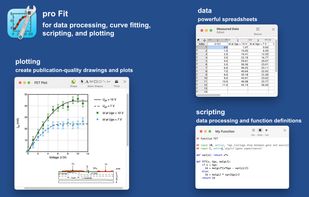
pro Fit, the best curve fitting, regression, plotting, data analysis for macOS. Python and LaTeX support, publication quality plots.


Veusz is a scientific plotting and graphing program with a graphical user interface, designed to produce publication-ready 2D and 3D plots.
 United Kingdom



Delineate provides facilities to edit and draw graphs specified in the DOT language It is designed to be a simple and intuitive tool for creating and editing graphs, with a focus on the user experience.
 Philippines




This macOS-native scientific workspace enables importing tabular datasets, creating X&Y plots, 3D plots, histograms, heat maps, and correlation charts, with seamless editing, pixel-perfect annotations, vector export, raw data privacy, and optional hosted assistant.