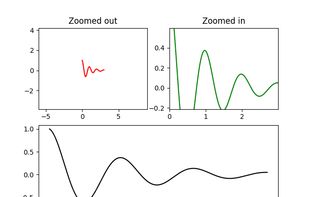
Matplotlib is a comprehensive library for creating static, animated, and interactive visualizations in Python. Matplotlib makes easy things easy and hard things possible.
Cost / License
- Freemium
- Open Source
Since
- Since 2010
 United States


+1


The best free alternative to OriginPro is Matplotlib, which is also Open Source. If that doesn't suit you, our users have ranked more than 50 alternatives to OriginPro and many of them is free so hopefully you can find a suitable replacement. Other interesting free alternatives to OriginPro are GnuPlot, LabPlot, Plotly and SciDaVis.
Matplotlib is a comprehensive library for creating static, animated, and interactive visualizations in Python. Matplotlib makes easy things easy and hard things possible.
United States
Gnuplot is a portable command-line driven interactive data and function plotting utility. It was originally intended as to allow scientists and students to visualize mathematical functions and data. It does this job pretty well, but has grown to support many non-interactive...


LabPlot is a free, open source and cross-platform Data Visualization and Analysis software accessible to everyone and trusted by professionals.
 Germany
 EU


Plotly is the easiest way to graph and share data online. Open-source libraries for JavaScript (comparison with HighCharts at https://plot.ly/highcharts-alternative/), Python, R, and MATLAB.
United States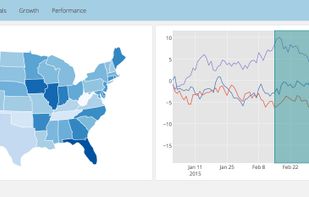
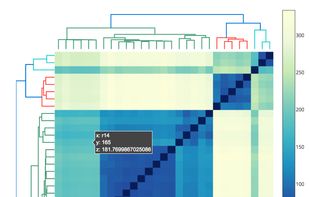
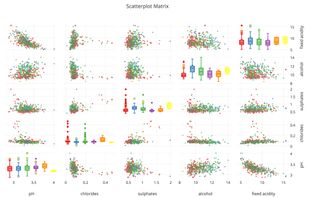


SciDAVis is a free application for Scientific Data Analysis and Visualization. It's an application aimed at data analysis and


Graphs is a simple, yet powerful tool that allows you to plot and manipulate your data with ease. You can import data from different typefiles such as text, csv, spreadsheets (xlxs and ods), sqlite database, x-ray diffraction formats, or generate data via an equation.
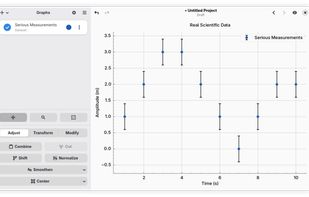
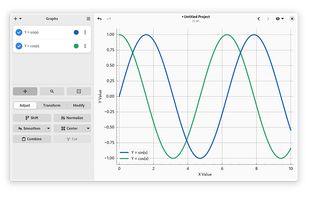
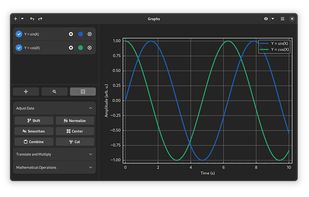
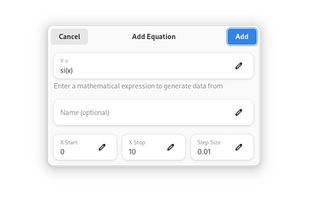


Graph is an open source application used to draw mathematical graphs in a coordinate system. Anyone who wants to draw graphs of functions will find this program useful. The program makes it very easy to visualize a function and paste it into another program.


Python(x,y) is a free scientific and engineering development software for numerical computations, data analysis and data visualization based on Python programming language, Qt graphical user interfaces and .
 FranceEU
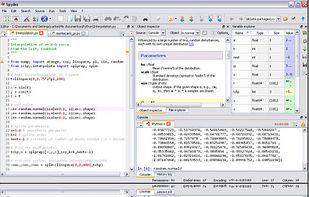


Alpha Plot is a free application for Scientific Data Analysis and Visualization for Windows, Linux and Mac OS X. It is a fork of scidavis under active development.


Open source framework for numerical computations and advanced statistical analysis, featuring nonlinear curve fitting, ODE solving, 1D/2D publication-quality visualization, Fourier and wavelet transforms, intuitive syntax, and namespace-based code organization for research.
GermanyEU


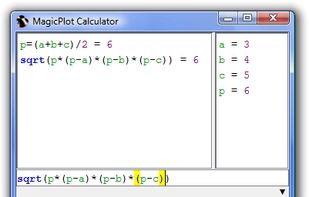
MagicPlot is cross-platform application for scientific and engineering plotting, non-linear and multipeak curve fitting and batch processing. MagicPlot produces high-quality plots and offers handy plot navigation. Project files have .mppz extention.
United States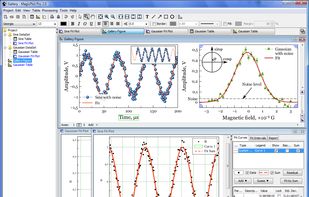

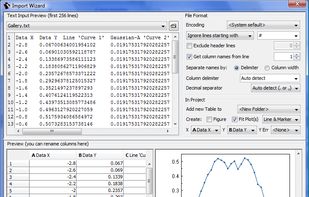


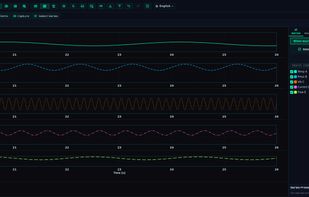
LOGADEC is time-series visualization and analysis software that runs in your web browser from a single HTML file. It needs no installation or administrator rights and makes no network connections while running, so it works on isolated test benches and locked-down corporate PCs...