Gephi is the leading visualization and exploration software for all kinds of graphs and networks. Gephi is open-source and free.
 France
 EU


+2


Apps similar to Neo4j Bloom include Gephi, which is free and open source. Other options are Graphviz, Penrose, Kumu and Graph Commons. You can choose from more than 10 Diagram Editors like Neo4j Bloom for the web, Windows, Mac, Linux and self-hosting.
Gephi is the leading visualization and exploration software for all kinds of graphs and networks. Gephi is open-source and free.
FranceEU
Graphviz is open source graph visualization software. Graph visualization is a way of representing structural information as diagrams of abstract graphs and networks. It has important applications in networking, bioinformatics, software engineering, database and web design...
 United States


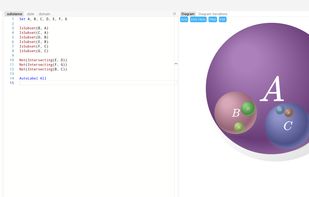
Penrose is a platform that enables people to create beautiful diagrams just by typing mathematical notation in plain text. The goal is to make it easy for non-experts to create and explore high-quality diagrams and provide deeper insight into challenging technical concepts.
United States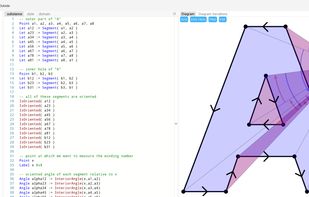
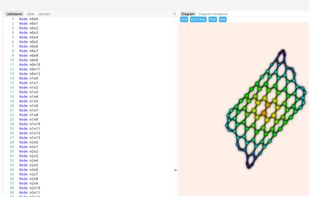


Kumu is a powerful data visualization platform that helps you organize complex information into interactive relationship maps.
United States


Graph Commons is a collaborative network-mapping platform. Graph Commons AI turns a prompt, pasted notes, a list, or a spreadsheet into a live network — the organizations in an ecosystem, the stakeholders around a project or policy, a market of competitors, partners, and...


Linkurious provides a graph visualization and analysis platform used for fraud detection, anti-money laundering, intelligence or cybersecurity. Easy to deploy and highly extensible, Linkurious Enterprise makes it easy to uncover insights hidden in complex connected data.
FranceEU


Hume is a graph analytics solution backed by Neo4j. It brings analysts and data scientists the full power of graph data, queries, and algorithms.
 United Kingdom


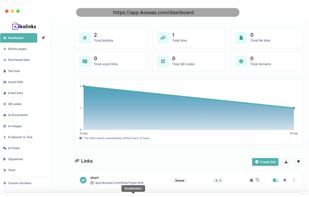
Explore a world of curated content, helpful resources, and exciting updates. Sign Up below to discover more about Bio Links Tool. Do everything with one platform.


Empowering the demanding needs of intelligence analysts, law enforcement, investigators, researchers, and information workers, Sentinel Visualizer is the next generation data visualization and analysis solution for your big data.
United States


KeyLines is a JavaScript toolkit used by developers to build powerful network visualization applications, quickly.
United Kingdom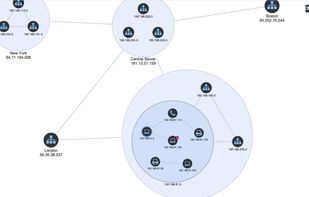
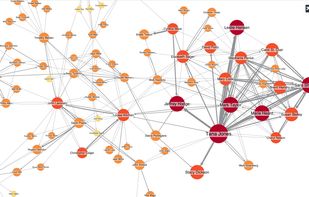
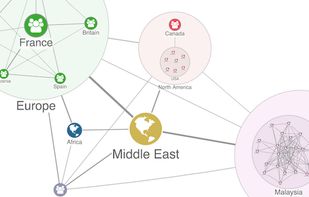


Tom Sawyer Software is the leader in graph visualization and analysis software. We help you gain new understanding from your data and enhance your applications.


TextQuery is a desktop app that lets you import data file as a table, query it using SQL, and create stunning charts from those results.