
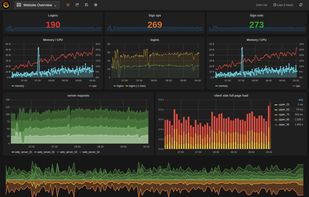
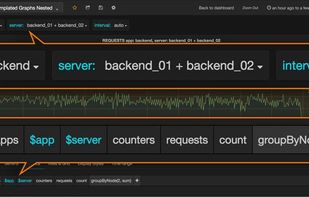
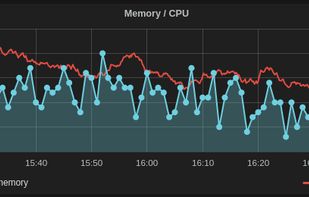
Grafana provides a powerful and elegant way to create, explore, and share dashboards and data with your team and the world.
 Sweden
 EU



+1






Grafana provides a powerful and elegant way to create, explore, and share dashboards and data with your team and the world.
SwedenEU
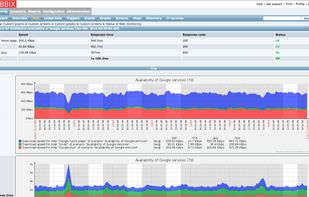
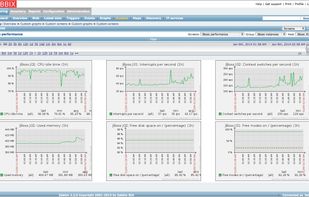
An uncompromising mature enterprise-level platform designed for real-time monitoring of millions of metrics collected from tens of thousands of servers, virtual machines and network devices, effortlessly scaling to even larger environments.
 LatviaEU

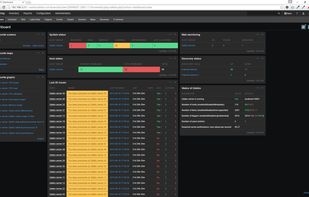


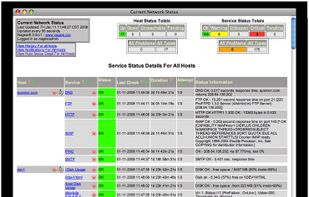
Nagios is a powerful monitoring system licensed under Nagios Enterprises that helps organizations identify and resolve IT infrastructure issues.
 United States


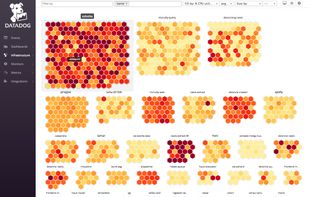
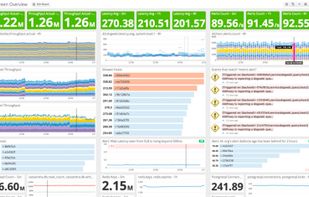
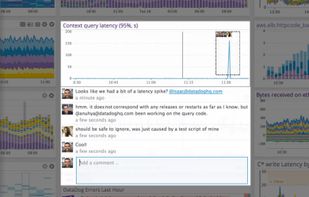
Monitor and visualize your IT and DevOps environments seamlessly with over 120 integrations, enabling real-time insight across on-premise and cloud deployments. Utilize robust analytics, graphing, and correlation tools for error logging and network monitoring. Improve collaboration and proactive IT management.
United States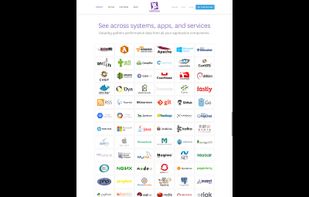


Splunk is software that provides unique visibility across your entire IT infrastructure from one place in real time. Only Splunk enables you to search, report, monitor and analyze streaming and historical data from any source.
United States


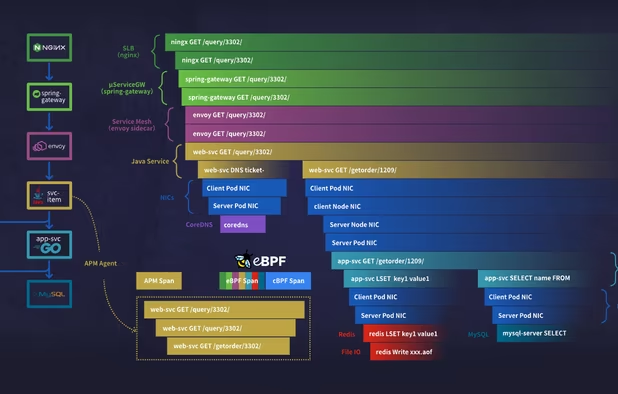
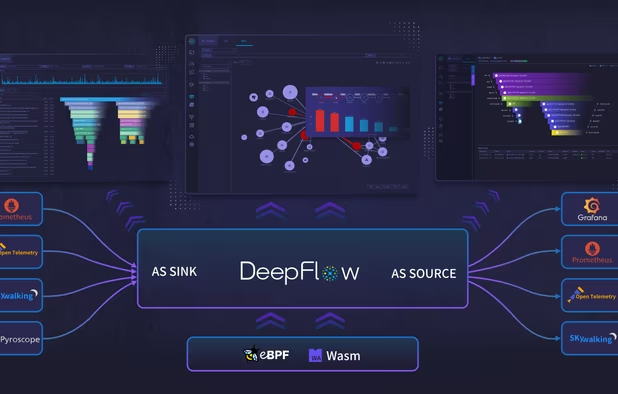
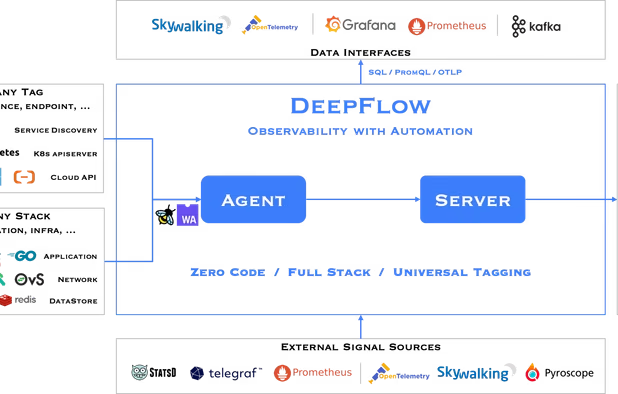
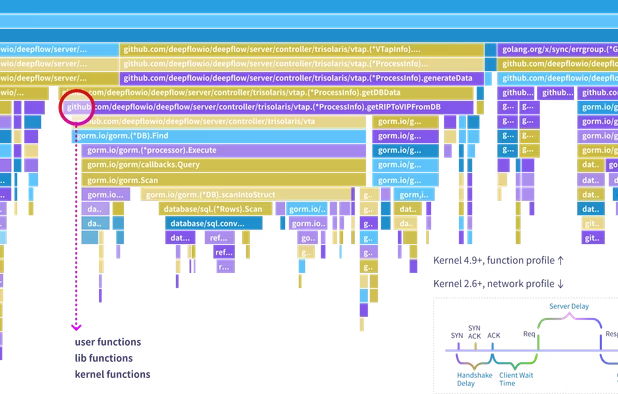
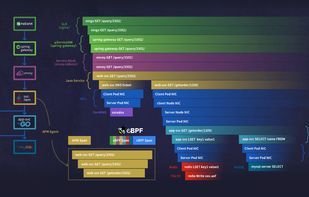
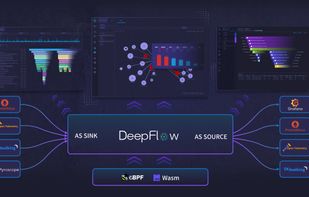
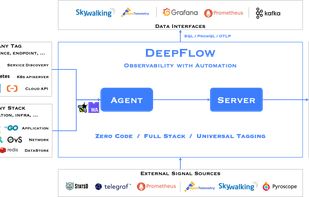
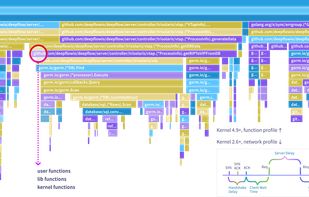
Unify your cloud-native monitoring with zero-code eBPF, advanced profiling, and 10x storage efficiency.
 China


Cloudshot offers a verity of features. It basically uses draw.io under the hood. This makes near to zero learning curve for the new user. Though Cloudshot is in its early stage, it offers verity of features such as -