





mectrics
1 like
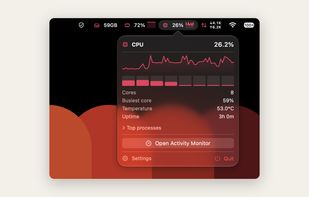
mectrics puts the readings you pick into the macOS menu bar: CPU, memory, battery, network, disk, GPU, temperature and fans. Clicking an item opens a popover with the detail behind the number, like per core load and top processes for CPU, or read and write throughput for disk.

Cost / License
- Free
- Open Source (MIT)
Platforms
- Mac


Features
mectrics News & Activities
Highlights All activities
Recent activities
 Danilo Venom added mectrics as alternative to Vitals for macOS
 Vitals added mectrics as alternative to Vitals Activity Monitor
- Ben liked mectrics
- Quite-Velocity added mectrics as alternative to Task Manager for macOS
- Faruk-Kam-ici added mectrics
 Faruk-Kam-ici added mectrics as alternative to iStat Menus, Stats and Activity Monitor


mectrics information
Developed by
 Faruk Kamçici
 Licensing
Open Source (MIT) and Free product.Written in
Alternatives
7 alternatives listedBadge
Get an embeddable badge for mectricsSupported Languages

AlternativeTo Categories
OS & Utilities, System & HardwareGitHub repository
- 156 Stars
- 7 Forks
- 2 Open Issues
- Updated


No comments or reviews, maybe you want to be first?