htop Alternatives
htop is described as 'Interactive process viewer for Linux. It text-mode application (for console or X terminals) and requires ncurses. htop is an interactive top replacement that runs in the terminal. The available columns are: PID, STATE, PPID, PGRP, SESSION, TTY_NR, TPGID, MINFLT' and is a very popular process management tool in the os & utilities category. There are more than 50 alternatives to htop for a variety of platforms, including Linux, Windows, Mac, BSD and Flathub apps. The best htop alternative is Process Explorer, which is free. Other great apps like htop are System Informer, btop++, Glances and Mission Center.
Alternatives list
Cost / License
- Free
- Open Source
Application types
Platforms
- Mac
- Windows
- Linux
 +3
+3 B
B
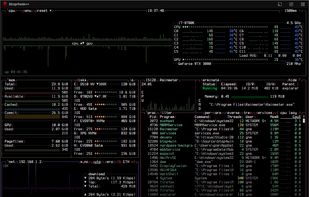
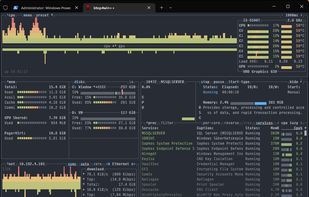
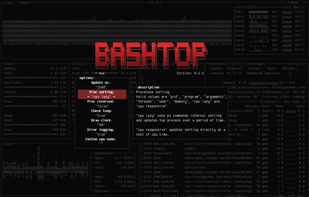
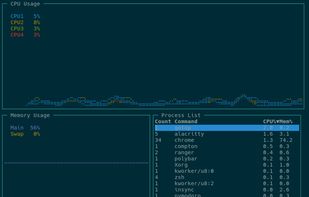
 20 btop4win alternatives
The Windows version of btop++, which is itself the re-implementation and continuation of bashtop and bpytop written in C++. A rich, featureful terminal-based resource monitor that shows usage and statistics for processor, memory, disks, network, processes and services.
 +2
+2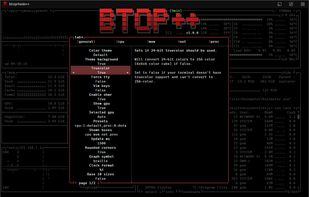


Cost / License
- Free
- Open Source (Apache-2.0)
Application types
Platforms
- Mac
- Linux
- BSD
- GNU Bourne Again SHell

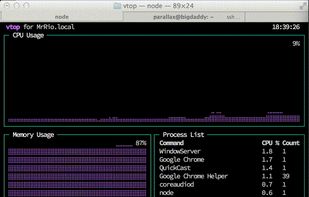
 58 vtop alternatives
vtop is a graphical command-line tool that uses unicode braille to chart CPU and memory usage. It can be easily extended.

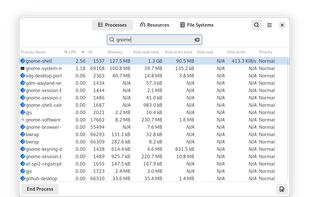
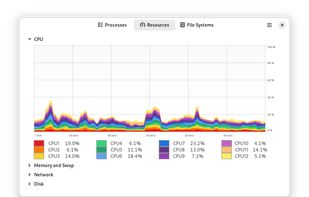
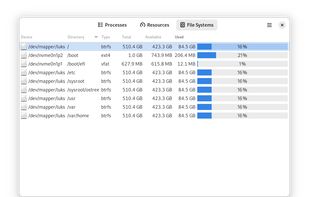
 82 GNOME System Monitor alternatives
System Monitor is a tool to manage running processes and monitor system resources.
 +3
+3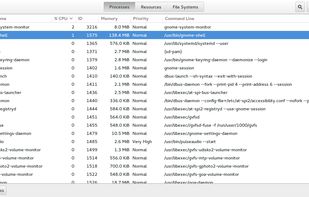

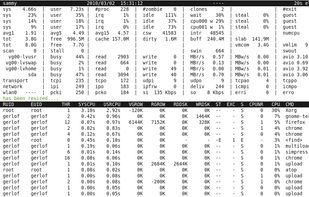
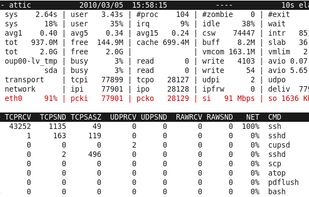
 18 Atop alternatives
An advanced interactive monitor for Linux-systems to view the load on system-level and process-level.
Cost / License
- Free
- Open Source
Platforms
- Linux


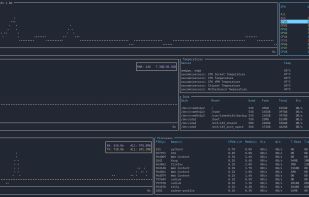
ca. 2020-01-25 The original author of gotop started a new tool in Rust, called ytop, and deprecated his Go version. This repository is a fork of original gotop project with a new maintainer to keep the project alive and growing.


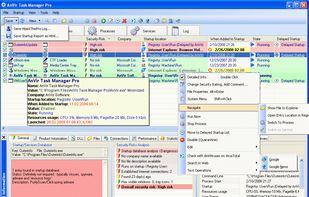
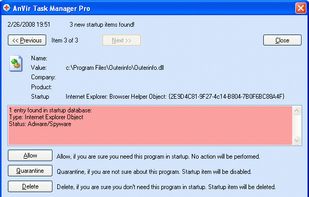
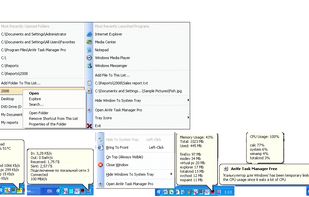
This tool controls programs, disk, CPU. Replace task manager, tweak and tune up XP or Vista. Speed up windows startup. Get rid of spyware and viruses.
Cost / License
- Freemium
- Proprietary
Alerts
- Warning
Platforms
- Windows

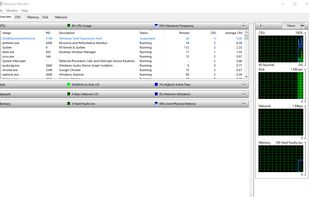
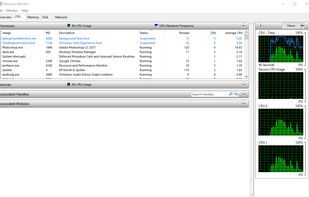
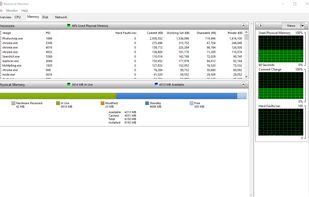
 56 Resource Monitor alternatives
Resource Monitor is a system application in Microsoft Windows operating systems. It is used to view information about the use of hardware (CPU, memory, disk, and network) and software (file handles and modules) resources in real time.
 +2
+2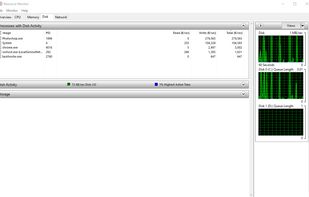


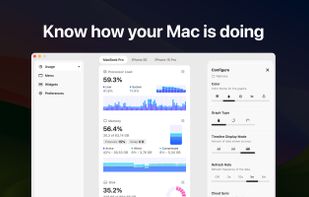
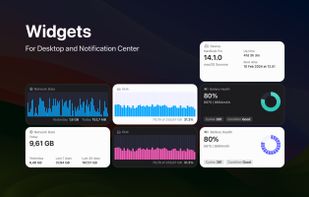
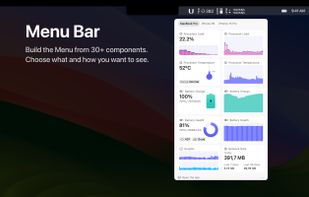
System Activity Monitor for Mac, iPhone, and iPad. Customizable, precise, and lightweight apps to keep an eye on the activity and performance of your devices.
 +6
+6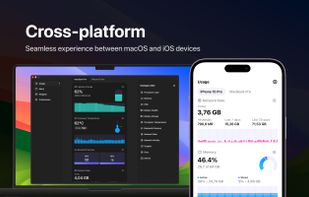

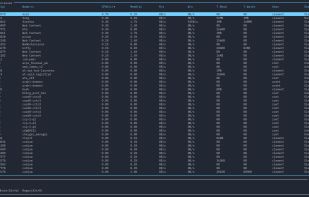
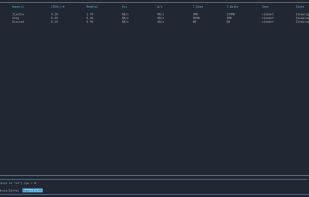
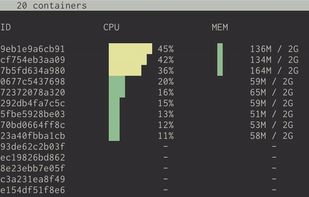
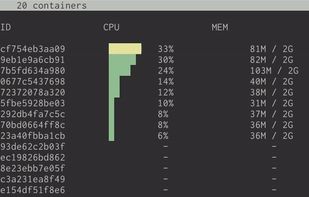
 55 Ctop alternatives
Top-like interface for container metrics. ctop provides a concise and condensed overview of real-time metrics for multiple containers as well as a single container view for inspecting a specific container.
Cost / License
- Free
- Open Source (MIT)
Platforms
- Linux
- Go (Programming Language)
- Docker


It has lots of info in just one screen. It's even better than htop. Nonetheless I have both installed, just in case.