Graphviz Alternatives
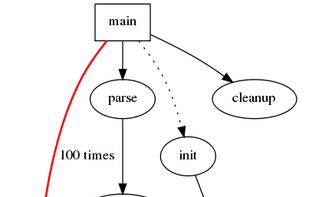
Graphviz is described as 'Is open source graph visualization software. Graph visualization is a way of representing structural information as diagrams of abstract graphs and networks. It has important applications in networking, bioinformatics, software engineering, database and web design' and is a popular Diagram Editor in the business & commerce category. There are more than 50 alternatives to Graphviz for a variety of platforms, including Windows, Mac, Web-based, Linux and Self-Hosted apps. The best Graphviz alternative is yEd Graph Editor, which is free. Other great apps like Graphviz are Microsoft Visio, Mermaid, PlantUML and Gephi.
Alternatives list

 +3
+3


 55 Ilograph alternatives
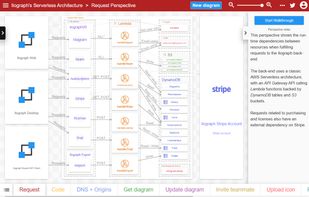
With Ilograph diagrams, you define your resources once, then show how they're related from many different perspectives. Seamlessly change perspectives to demonstrate cross-functional dependencies and shared responsibilities.


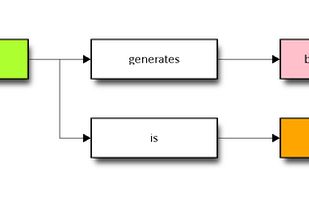
Theory Maker is a free web app by Steve Powell for making any kind of causal diagram, i.e. a diagram which uses arrows to say what contributes to what. You make the diagrams just by typing the names of the elements (called variables) in a structured way into a (resizeable)...
Cost / License
- Free
- Open Source
Platforms
- Online
 +5
+5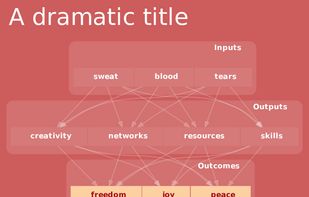


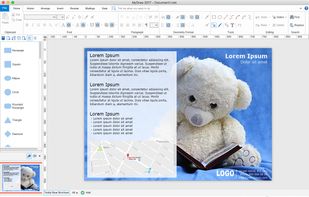
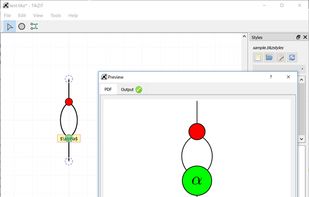
MyDraw is an easy to use, yet powerful diagramming software that lets you create a large number of diagrams like flowcharts, organizational charts, mind maps, network diagrams, floor plans, family trees, business model diagrams, and many more.
 +9
+9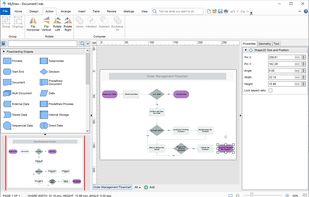


Generate diagrams from text faster than ever and facilitate stakeholders involvement via animation and online collaboration.


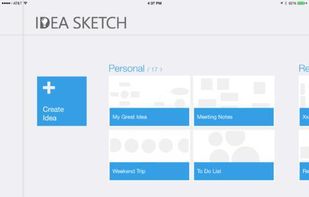
Lets you easily draw a diagram - mind map, concept map, or flow chart - and convert it to a text outline, and vice versa.
Cost / License
- Freemium
- Proprietary
Application types
Alerts
- Discontinued
Platforms
- Windows
- iPhone
- Windows Phone
- iPad
 +2
+2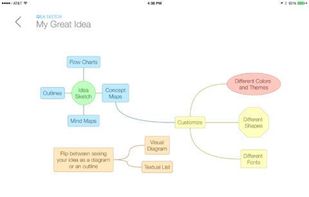

 B
B
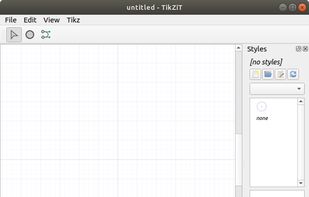
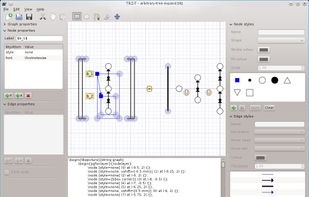
TikZiT is a super simple GUI editor for graphs and string diagrams. Its native file format is a subset of PGF/TikZ, which means TikZiT files can be included directly in papers typeset using LaTeX.

Dracula is a set of tools to display and layout interactive graphs, along with various related algorithms.
Cost / License
- Free
- Open Source
Platforms
- Online
 D
D
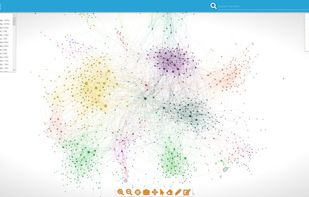
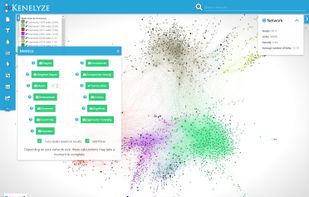
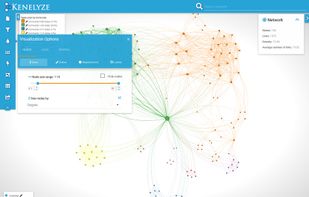
Kenelyze is a visual analytics platform which allows anyone to create fully interactive network maps on the fly using any dataset.


A simple way of describing graphs and include it easily in your web for free, blog, markdown page, github, and any location where remote images can be showed.
 +1
+1


It is very good for small custom Images