Grafana Alternatives
Grafana is described as 'Provides a powerful and elegant way to create, explore, and share dashboards and data with your team and the world' and is a very popular business intelligence tool in the network & admin category. There are more than 50 alternatives to Grafana for a variety of platforms, including Web-based, Self-Hosted, SaaS, Linux and Mac apps. The best Grafana alternative is Netdata, which is free. Other great apps like Grafana are Metabase, Kibana, Datadog and Beszel.
Alternatives list

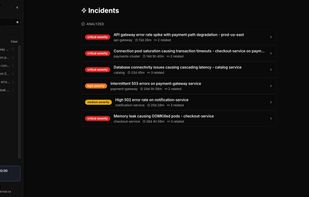
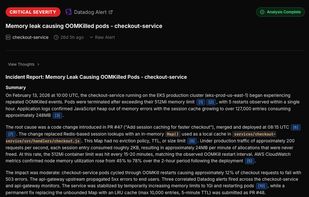
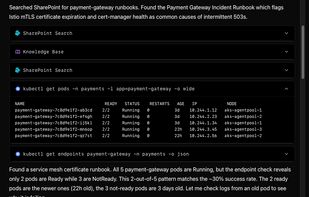
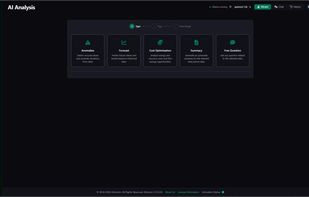
Aurora is an automated root cause analysis investigation tool that uses agents to solve incidents for Site Reliability Engineers.
Cost / License
- Free
- Open Source (Apache-2.0)
Platforms
- Online
- Self-Hosted
- Docker
 +3
+3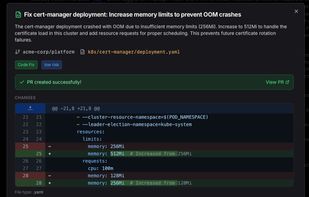


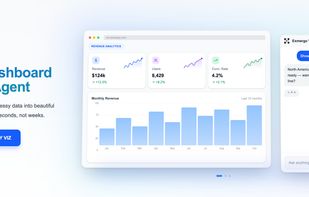
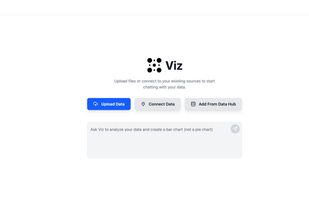
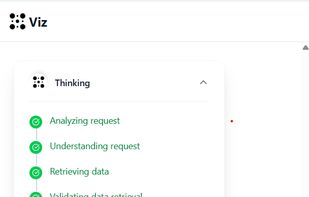
 8 Exmergo Viz alternatives
Exmergo Viz is the Dashboard AI Agent. It lets anyone build shareable, interactive, and reliable dashboards without the steep learning curve of traditional BI tools like Tableau and Power BI. Just talk to Viz in natural language, and it builds charts and dashboards for you in...
Cost / License
- Freemium
- Proprietary
Platforms
- Online
- Software as a Service (SaaS)
 +3
+3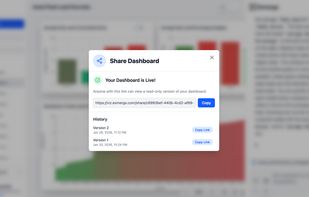


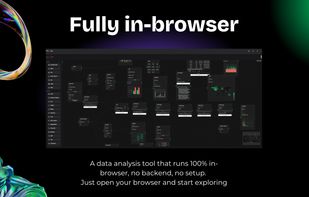
The super easy-to-use web data engine with 300+ drag & drop nodes, AI insights, data-to-voice podcasts and even narrated dashboards. All in one place, with zero setup.
Cost / License
- Freemium
- Proprietary
Platforms
- Online

 +4
+4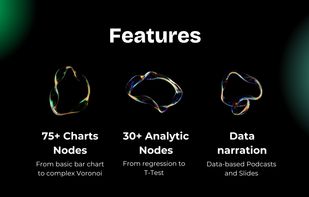


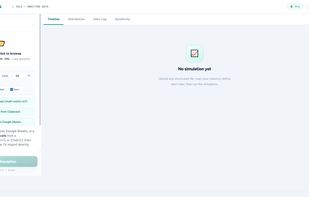
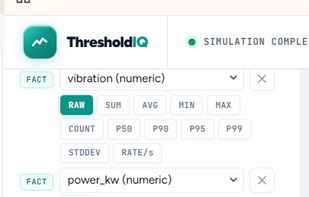
I built ThresholdIQ after getting paged at 3am because of badly tuned alert thresholds. The classic problem: set them too low ? alert fatigue, set them too high ? miss critical issues.
Cost / License
- Free
- Proprietary
Platforms
- Online
- Software as a Service (SaaS)

 +3
+3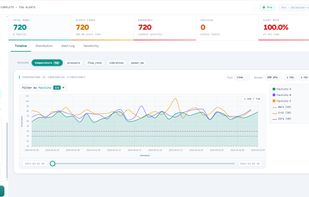


An industrial data acquisition software that connects to any OPC UA automation system. Collect, visualize, and analyze your process data in real time — with on-premises AI powered by local LLMs.
Cost / License
- Freemium
- Proprietary
Platforms
- Windows
- Linux
 +2
+2


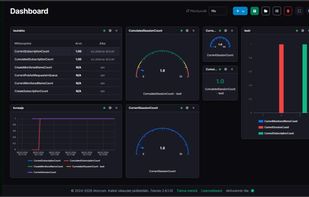
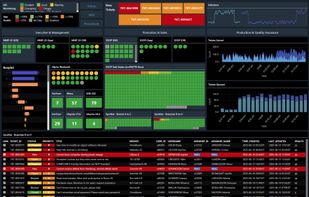
The Engineered Monitoring Platform, short EMP, is a project that arised to address the need of having an easy to customize monitoring, data analytics and dashboarding solution. Company and team-specific data visualization can be created on the fly, without the necessity to rely...
Cost / License
- Free
- Open Source (MIT)
Platforms
- Self-Hosted
 +2
+2


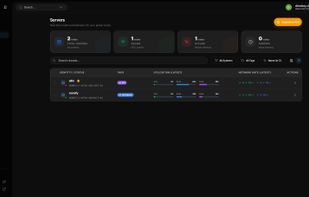
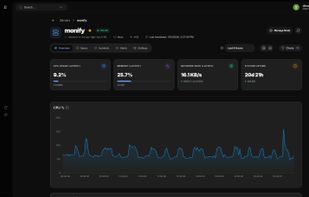
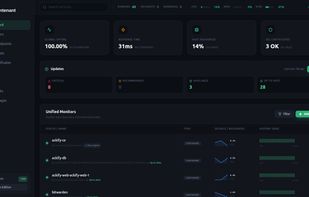
Lightweight server monitoring for developers and small teams with a Go-based agent using 12-18MB RAM, real-time dashboards, drag-and-drop builder, built-in alerts for major services, one-command setup, no need for exporters or complex configs, and a free tier for two servers.
Cost / License
- Freemium
- Proprietary
Platforms
- Linux
- Online


Nveil turns raw data into stunning, interactive visualizations in seconds using generative AI, no code, no templates, no design skills required.
Cost / License
- Paid
- Proprietary
Application type
Platforms
- Online
- Software as a Service (SaaS)
 +2
+2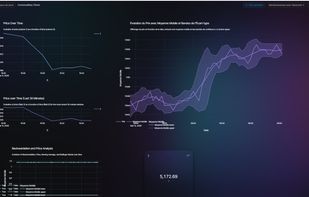


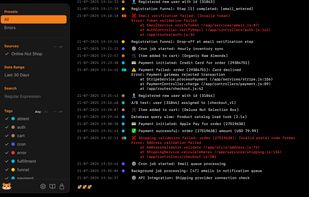
A simple and lightweight tool that allows you to capture logs from your applications and monitor them in one easy dashboard.
Cost / License
- Paid
- Proprietary
Platforms
- Online


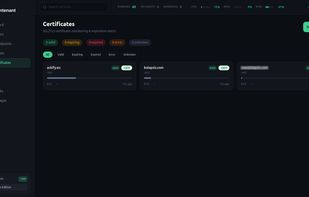
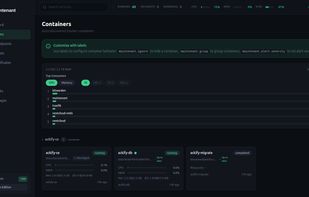
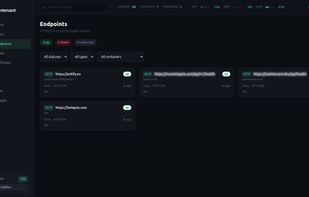
Self-hosted Docker and Kubernetes monitoring in a single container — containers, endpoints, cron jobs, SSL certs, image updates, network security, and status page.
 +6
+6