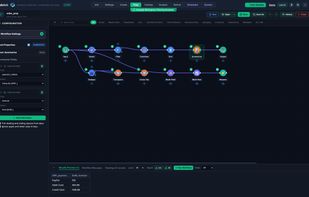
Datok builds data workflows on a visual canvas: read a file, join it, clean it, summarise it, write it out, watching the row counts change at each step. There are 45 tools, including joins, fuzzy matching, dedupe, regular expressions, text-to-columns and multi-row formulas.
The result goes into a pivot with drag-and-drop rows, columns and values, percent of row, column and grand total, and per-measure number formats, then into any of 41 chart types — bar and line through to Sankey, sunburst, org charts and cartograms — arranged as dashboards with their own filters.
Processing happens on your own computer. The browser version works on your files in the browser; the Windows desktop app runs a local server on your machine. Your data is never uploaded to Datok. Saved work lives in your own folder as a single file, with version history alongside it.
The browser version reads Excel, CSV, JSON and SQLite, and needs Chrome, Edge or Opera. The Windows desktop app adds Parquet, Avro, Tableau .hyper and Alteryx .yxdb, plus optional local AI through Ollama, which you install yourself. One plan at EUR 19.97 a month; the first eight hours of the web version are free.







 EU




 OmNexis s.r.o.


No comments or reviews, maybe you want to be first?