


GeoGebra is free and multi-platform dynamic mathematics software for learning and teaching. It has received several educational software awards in Europe and the USA.
Cost / License
- Free
- Source Available
Since
- Since 2009
 Austria
 EU


+2


Apps similar to Data Analysis Tool include GeoGebra, which is free. Other options are SciDaVis, NumeRe, GeoGebra Discovery and Winplot. In total there are seven Graphing Calculators like Data Analysis Tool for Windows, Mac, Linux, the web and Android.
GeoGebra is free and multi-platform dynamic mathematics software for learning and teaching. It has received several educational software awards in Europe and the USA.
AustriaEU
SciDAVis is a free application for Scientific Data Analysis and Visualization. It's an application aimed at data analysis and


Open source framework for numerical computations and advanced statistical analysis, featuring nonlinear curve fitting, ODE solving, 1D/2D publication-quality visualization, Fourier and wavelet transforms, intuitive syntax, and namespace-based code organization for research.
 GermanyEU


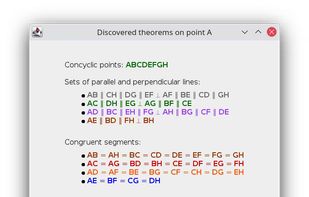
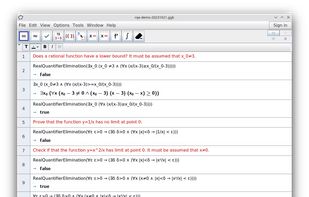
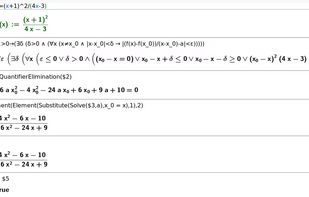
GeoGebra Discovery is an experimental version of GeoGebra. It contains some bleeding edge features of GeoGebra that are under heavy development and therefore not intended for every day use yet, so they are not included in the official GeoGebra version.
AustriaEU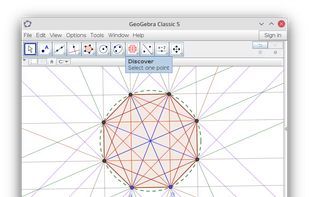


"Winplot is a free graphing utility that was written by Richard Parris, a math instructor at Phillips Exeter Academy in Exeter, New Hampshire. Sadly Richard passed away in 2012. After Richard's death the program was still available for a number of years on the Exeter...


Technical graphing and data analysis for Macintosh and Windows. IGOR Pro creates publication quality scientific graphics used by scientists and engineers around the world. IGOR Pro 6 is an extraordinarily powerful and extensible scientific graphing, data analysis, image...


During the ECU development process, measurement data that refers to different states of calibration data must be compared. The ETAS MDA (Measure Data Analyzer) measurement data analysis tool lets users visualize, further process, analyze, and document measurement data.


