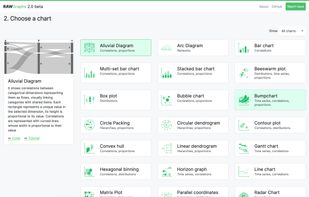
RAWGraphs is an open source app built with the goal of making the visualization of complex data easy for everyone. Born as tool for designers and vis geeks, RAWGraphs aims at providing a missing link between spreadsheets and vector graphics editors.

Chartquery is described as 'REST API tool for generating charts, diagrams, QR codes, barcodes, and labels, supporting formats like Mermaid, PlantUML, and GraphViz for instant visualization' and is a charting library tool in the photos & graphics category. There are more than 25 alternatives to Chartquery, not only websites but also apps for a variety of platforms, including Windows, Self-Hosted, Mac and Linux apps. The best Chartquery alternative is RAWGraphs, which is both free and Open Source. Other great sites and apps similar to Chartquery are D3.js, Plotly, Chart.js and QZ Tray.
RAWGraphs is an open source app built with the goal of making the visualization of complex data easy for everyone. Born as tool for designers and vis geeks, RAWGraphs aims at providing a missing link between spreadsheets and vector graphics editors.

D3.js is a JavaScript library for manipulating documents based on data. D3 helps you bring data to life using HTML, SVG, and CSS.


Plotly is the easiest way to graph and share data online. Open-source libraries for JavaScript (comparison with HighCharts at https://plot.ly/highcharts-alternative/), Python, R, and MATLAB.


Easy, object oriented client side graphs for designers and developers. Open source HTML5 charts using the canvas tag. Chart.js is an easy way to include animated graphs on your website.


Print raw (ZPL, ESC/P, FGL), HTML, PDF as well as communicate with USB, HID, and serial devices through a cross-platform browser plugin.


gLabels is a program for creating labels and business cards for the GNOME desktop environment. It is designed to work with various laser/ink-jet peel-off label and business card sheets that you'll find at most office supply stores.


The Google Charts is an extremely simple tool that lets you easily create a chart from some data and embed it in a webpage. You embed the data and formatting parameters in an HTTP request, and Google returns a PNG image of the chart.

Apache ECharts is a free, powerful charting and visualization library offering easy ways to add intuitive, interactive, and highly customizable charts to your commercial products. It is written in pure JavaScript and based on zrender, which is a whole new lightweight canvas...


Highcharts is a charting library written in pure JavaScript, offering an easy way of adding interactive charts to your web site or web application. Highcharts currently supports line, spline, area, areaspline, column, bar, pie and scatter chart types.

CanvasJS is an easy to use HTML5 and Javascript Charting library. It runs across devices including iPhone, iPad, Android, Windows Phone, Microsoft Surface, Desktops, etc. This allows you to create rich dashboards that work on all the devices without compromising on...


Neodynamic ThermalLabel SDK for .NET is a lightweight class library (DLL) that lets you to design barcode labels and print them to Zebra Thermal Printers (ZPL or EPL) by writing just pure .NET code in VB.NET or C#.
Datamatic is like WordPress for data visualizations, it offers 70+ interactive data visualization templates, Excel-like data editor & beautiful material design styles. Data visualizations can be easily embedded in any website or web application.