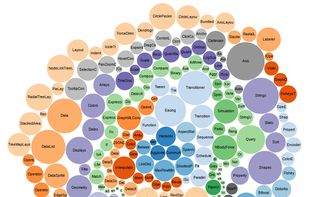
D3.js is a JavaScript library for manipulating documents based on data. D3 helps you bring data to life using HTML, SVG, and CSS.
 United States




+5


Apps similar to Apache Echarts include D3.js, which is free and open source. Other options are Tableau, RAWGraphs, Plotly and Google Charts. You're spoiled for choice with Charting Library Tools like Apache Echarts: we list more than 25 alternatives for the web, self-hosting, Mac, Windows and Linux.
D3.js is a JavaScript library for manipulating documents based on data. D3 helps you bring data to life using HTML, SVG, and CSS.
United States
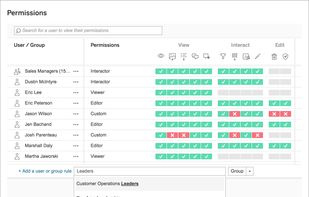
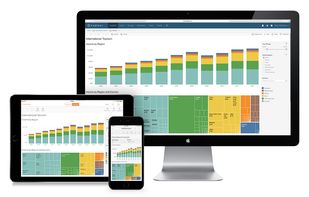
Tableau helps the world’s largest organizations unleash the power of their most valuable assets: their data and their people.
United States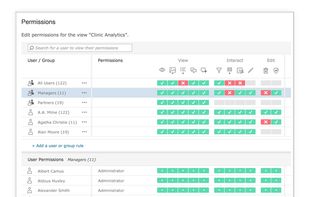
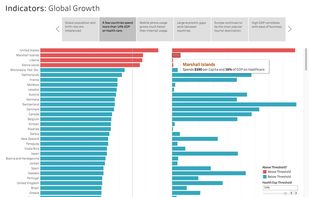


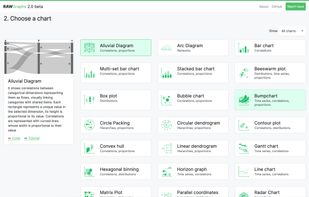
RAWGraphs is an open source app built with the goal of making the visualization of complex data easy for everyone. Born as tool for designers and vis geeks, RAWGraphs aims at providing a missing link between spreadsheets and vector graphics editors.
 Italy
 EU


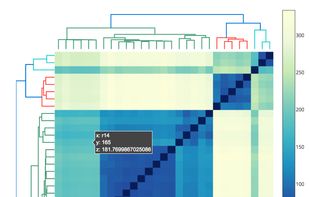
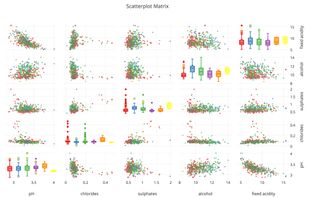
Plotly is the easiest way to graph and share data online. Open-source libraries for JavaScript (comparison with HighCharts at https://plot.ly/highcharts-alternative/), Python, R, and MATLAB.
United States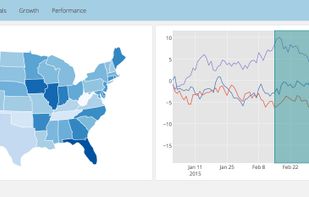


The Google Charts is an extremely simple tool that lets you easily create a chart from some data and embed it in a webpage. You embed the data and formatting parameters in an HTTP request, and Google returns a PNG image of the chart.
United States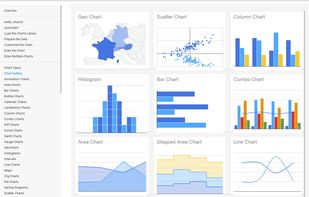


A general purpose real-time charting library for building beautiful, smooth, and high performance visualizations.


Create insightful reports & dashboards, Visually analyze your business information. Easily create insightful reports & dashboards using a drag and drop interface. No IT help required.
 India
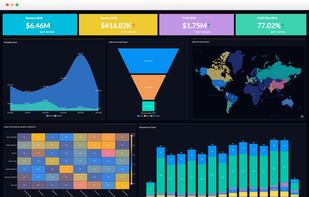


Highcharts is a charting library written in pure JavaScript, offering an easy way of adding interactive charts to your web site or web application. Highcharts currently supports line, spline, area, areaspline, column, bar, pie and scatter chart types.
 Norway
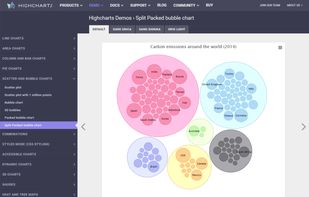


This project is an attempt to build re-usable charts and chart components for d3.js without taking away the power that d3.js gives you. This is a very young collection of components, with the goal of keeping these components very customizeable, staying away from your standard...


CanvasJS is an easy to use HTML5 and Javascript Charting library. It runs across devices including iPhone, iPad, Android, Windows Phone, Microsoft Surface, Desktops, etc. This allows you to create rich dashboards that work on all the devices without compromising on...
India
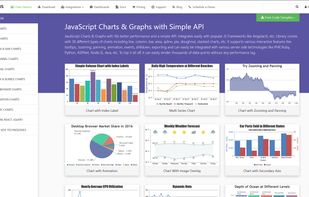
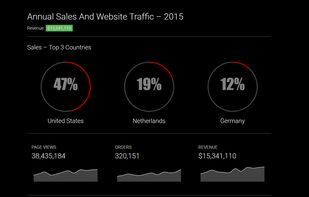


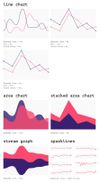
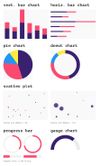
Chart is a plugin for Sketch, Figma, and Adobe XD. Try Chart to save yourself hours of manual, tedious work, and create a graph with real or random data in seconds. It's easy to make, edit, and customize different types of graphs.


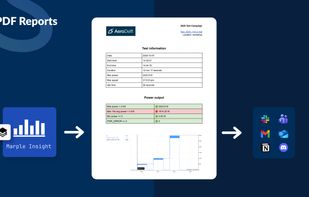
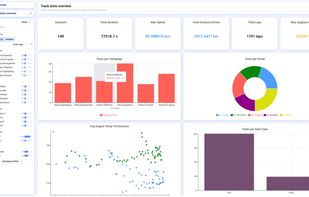
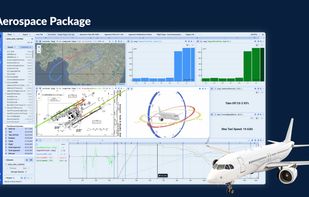
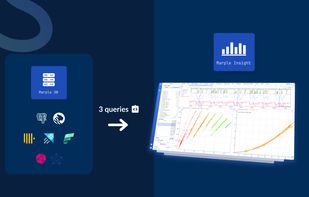
Marple Insight offers powerful tools for interactive analysis of high-frequency time-series data. Engineers and scientists from automotive, aerospace and manufacturing use it to explore, visualise, and analyse sensor or test data.
 BelgiumEU