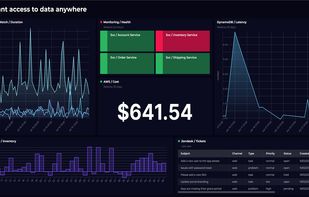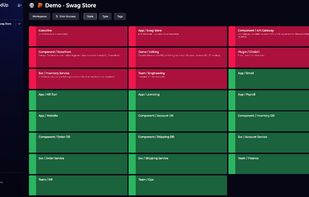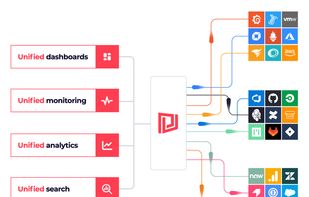

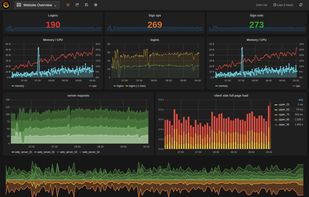
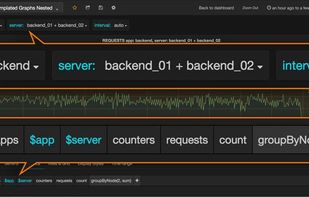
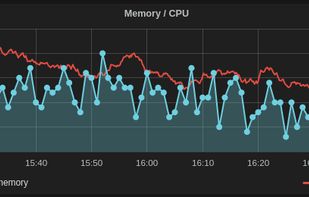
Grafana provides a powerful and elegant way to create, explore, and share dashboards and data with your team and the world.
 Sweden
 EU



+1





Apps similar to Chartbrew include Grafana, which is open source with a free version. Other options are Kibana, Microsoft Power BI, Redash and Serial Studio. You can choose from more than 10 Business Intelligence Tools like Chartbrew for self-hosting, the web, Windows, Linux and Mac.
Grafana provides a powerful and elegant way to create, explore, and share dashboards and data with your team and the world.
SwedenEU
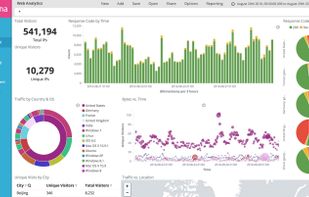
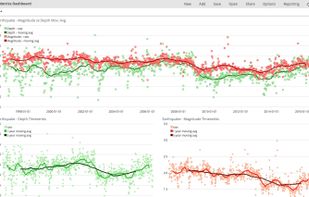
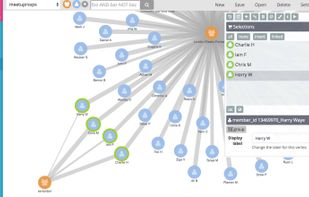
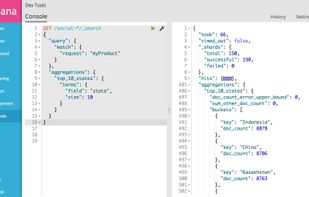
Open-source interface for real-time visualization, search, monitoring logs or metrics, anomaly detection, and natural language queries in Elasticsearch, supporting machine learning, automated alerting, threat detection, and integration with tools like Slack and ServiceNow.
 NetherlandsEU


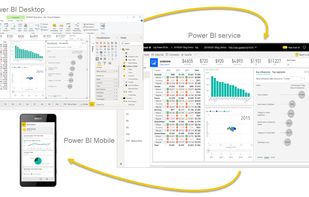
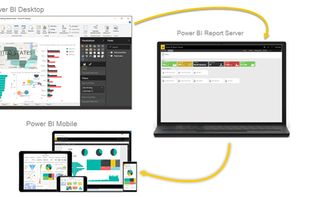
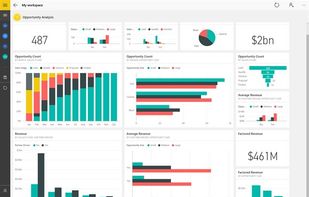
Utilize Microsoft's Power BI to convert varied data sources into interactive visual insights. It includes Power BI Desktop, online services, and mobile apps, allowing the creation, sharing, and consumption of business insights on any device, tailored to diverse business needs.
 United States



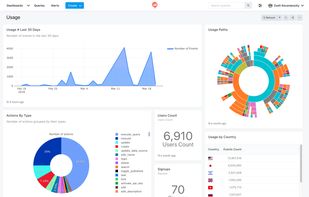
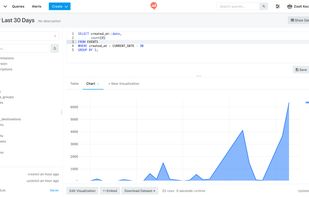
Redash helps you make sense of your data. Connect and query your data sources, build dashboards to visualize data and share them with your company.
United States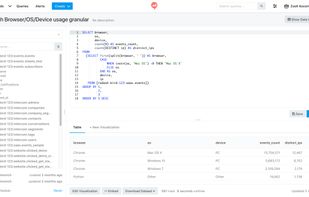


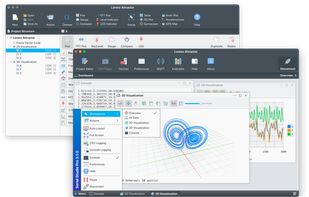
Serial Studio is an open-source, cross-platform telemetry dashboard and real-time data visualization tool. It supports input from serial ports, Bluetooth Low Energy (BLE), and TCP/UDP sockets. It's ideal for embedded devices, external tools, and network services.
 Mexico



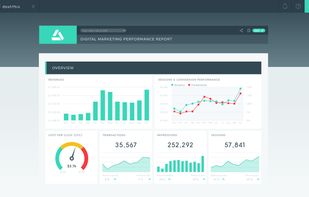
DashThis provides marketers with an easy-to-use, automated & attractive reporting tool. DashThis is integrated with over 34+ data sources, and is known as the best in the business in terms of customer support.
 Canada


A damn sexy, open source real-time dashboard builder for IOT and other web mashups. A free open source alternative to Geckoboard. Includes a powerful plugin architecture to create any amount of customization.
United States


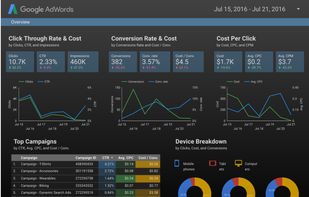
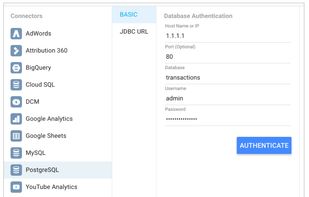
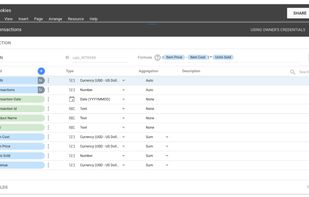
Data visualization and business intelligence (BI) platform for aggregating, sharing, collaborating, and pulling insights from raw databases, as well as built-in connections to Google products.
United States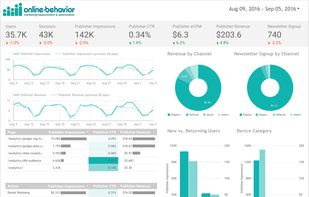


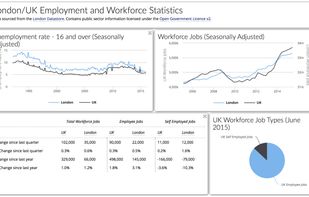
Browser-based solution for creating and hosting dashboards without programming, using declarative JSON configuration, customizable components, built-in editor, and support for multiple data sources, ideal for business intelligence and visualization needs.
United States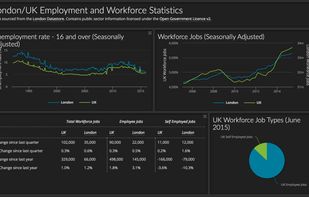



Create powerful dashboards from your company’s data and quickly discover insights with Chartio.
United States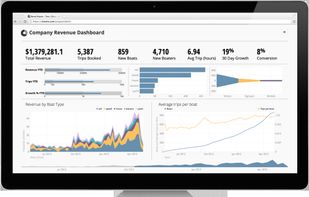


 United Kingdom