ATX AnalyticsTable icon

ATX AnalyticsTable

 Like

A grid on a real analytical engine. Connect the estate, clean data with repeatable pipelines, and let the morning report refresh, recalculate, export & back itself up before anyone opens a laptop.
ATX AnalyticsTable screenshot 1
ATX AnalyticsTable screenshot 2
+2
ATX AnalyticsTable screenshot 3

Cost / License

  • Freemium (Pay once or Subscription)
  • Proprietary

Since

  • New

Platforms

  • Windows  The installer runs the whole product: the analytics workspace, the query engine, connections, pipelines, the scheduler, dashboards, reports and PII masking. No cloud account, no telemetry, and a licence that validates offline.
0likes
0articles
Save

Features

Properties

Features

Highlights All activities

ATX AnalyticsTable News & Activities

Recent activities

ATX AnalyticsTable information

  • Developed by

    PL flagATX Institute
  • Licensing

    Proprietary and Freemium product.
  • Pricing

    One time purchase ranging between $50 and $150, and / or subscription ranging between $20 and $100 per month + free version with limited functionality.
  • Alternatives

    9 alternatives listed
  • Badge

    Get an embeddable badge for ATX AnalyticsTable
  • Supported Languages

    • English
    • Polish
    • German
    • Spanish
    • Chinese
ATX AnalyticsTable was added to AlternativeTo by Grzegorz-K-os on and this page was last updated .

No comments or reviews, maybe you want to be first?

What is ATX AnalyticsTable?

AnalyticsTable is a desktop analytics workspace built around the grid your analysts already know, backed by a real analytical query engine. Connect to a database, a warehouse or files on disk, pull results into sheet tabs, clean and reshape them with repeatable recipes, add formulas, conditional formatting and charts, build dashboards — then let the application refresh, export and back everything up on a schedule, unattended.

It exists to retire one specific routine: the desktop file, the manual SQL and the copy-paste that produce a critical report every morning. What replaces it is automated, auditable and version-controlled — and still familiar to the analyst who owned the original report.

The grid sits in the middle because that is what the product is: a working surface where every row is the result of SQL you can open and read. Everything else either feeds it, builds on it, schedules it, watches what leaves it, or ships it somewhere.

The grid is not a view onto a database — it is the query result. Every row on screen comes from SQL you can open, read and edit, which is why the designer, the formula layer, pipelines and Ask Greg all attach to the same object rather than to four separate tools.

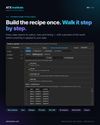
Pipelines and the scheduler are the same recipe twice. What you did by hand becomes an ordered, inspectable step list, and the scheduler re-applies it to refreshed data with per-step status and history.

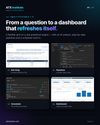
Ask Greg answers with queries it actually ran against your own database, and proposes charts, dashboards, pipelines, PDF reports, e-mail alerts and schedules as objects you place — every one dry-run against your data and certified before you see it.