empower® helps business teams create executive-ready presentations and documents faster with advanced, AI-powered slide and chart generation, and built-in design automation.
 Germany
 EU





+2


Apps similar to Aploris include empower® Suite. It's paid, but PlusX Excel Add-In and Lupus Labs are free. Other options are ChartEngine for Excel, think-cell chart, Ampler and UpSlide. You can choose from more than 10 Presentation Makers like Aploris for Windows, Mac, the web, Linux and Android.
empower® helps business teams create executive-ready presentations and documents faster with advanced, AI-powered slide and chart generation, and built-in design automation.
GermanyEU
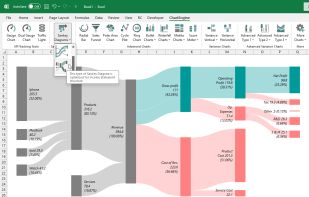
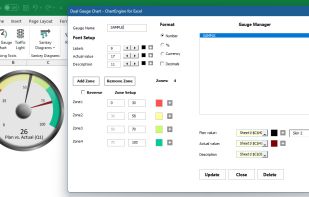
ChartEngine is a high-performance chart add-in for Excel and helps you tell a story using advanced charts, graphs, and widgets.
 United Kingdom
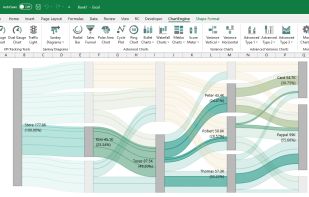



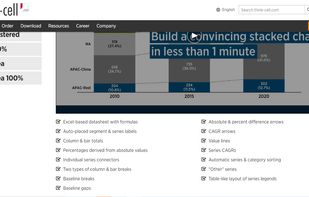
think-cell chart helps create bar charts, waterfall charts, Marimekko charts and Gantt charts, on Microsoft PowerPoint presentation slides from Microsoft Excel data sheets.
GermanyEU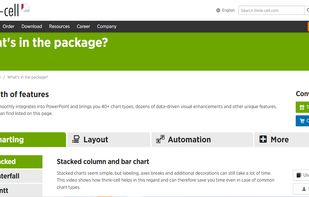


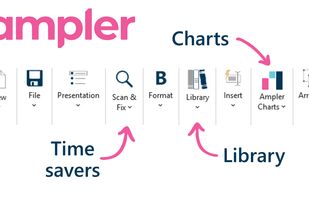
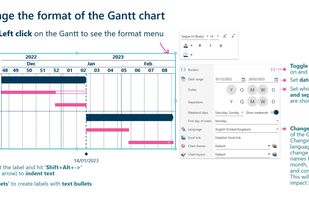
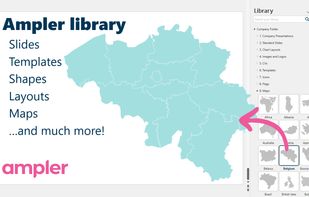
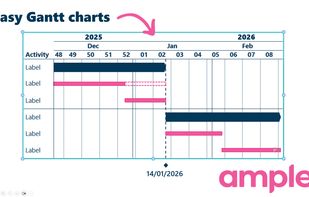
Ampler is a add-in for the Microsoft Office suite including PowerPoint, Excel, Word, and Outlook. Ampler Charts is a chart add-in for PowerPoint including amongst others Gantt and Waterfall charts.
 DenmarkEU


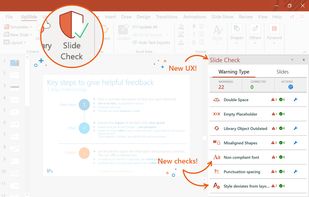
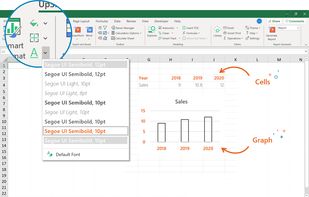
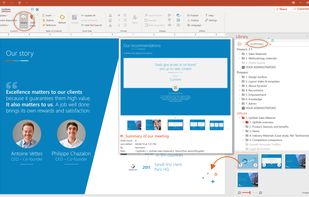
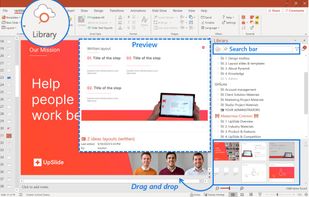
UpSlide plug-in allows you to perform routine Microsoft Excel, Word and PowerPoint tasks 5x faster making productivity gains of 12 hours per month. For example: link Excel to PowerPoint easily, access your up-to-date documents directly from Office...
 FranceEU


Flexible, cross-platform and cross-browser JavaScript (HTML5) charting library that allows you to create interactive bar, pie, line, spline, area, Gantt, stock and other charts, maps and dashboards, with real-time updates and multi-level drill-downs.
 United States
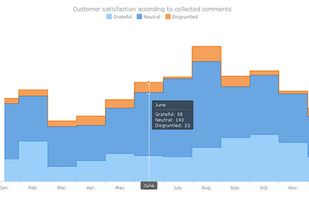
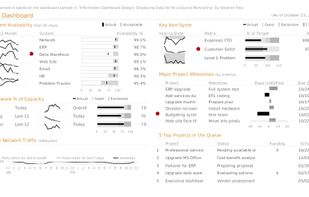
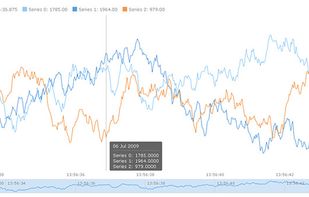
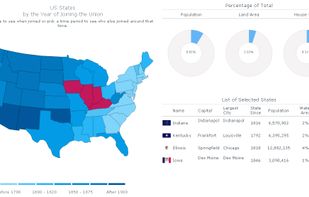


100% Free Excel Add-In for Waterfall, Gantt, QIGS, Mirror, BubbleX & Double Donut Charts and Live FX Rates. Also features usefull shortcuts and Excel-internal Web Browser. Supports 9 languages (EN,FR,DE,ES,TR,RU,AR,CH,IN).
 Türkiye
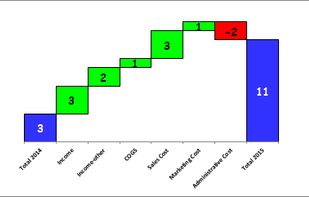
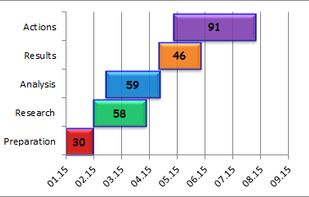
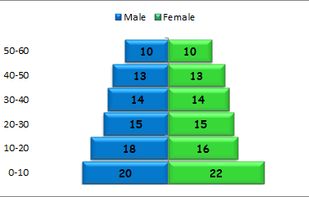
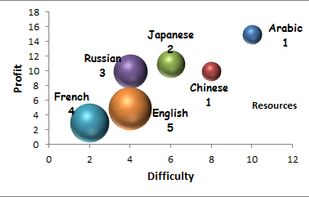


Peltier Tech Marimekko Chart Utility is a add-in for Microsoft Excel that enables quick creation of Marimekko charts.


Lupus Labs is a modern alternative to think-cell for automated, data-driven presentations. It generates and updates PowerPoint slides from structured data and supports clear roadmaps and timelines—reducing manual effort and ensuring consistency across reports and project plans.
GermanyEU


Quick Dashboard Charts for Excel is an add-in that provides Dashboards and custom charts types. This gallery contains different chart types.You can create custom Dashboard,graphs or charts in Excel.


Mekko Graphics provides all the charting capabilities you will need in one simple package that works seamlessly with Microsoft PowerPoint.

Create infographic style charts and navigation menu bars. Repair Excel files before they become corrupt. Copy and link Airt Magic charts in PowerPoint. Charts include waterfalls, gantt charts, speedometer type gauge charts and progress rings.