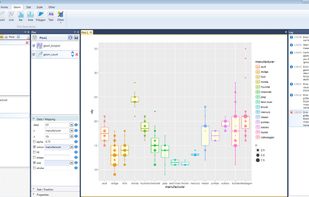
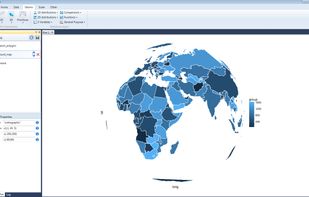
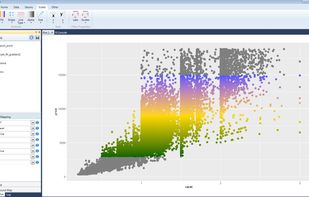
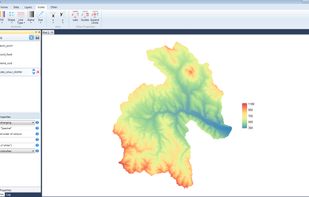
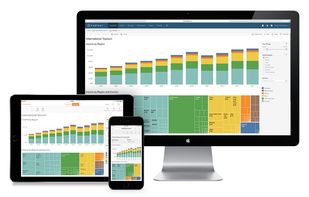
Tableau helps the world’s largest organizations unleash the power of their most valuable assets: their data and their people.
Cost / License
- Freemium
- Proprietary
Application type
Platforms
- Mac
- Windows
- Online
- Self-Hosted
 United States



+9
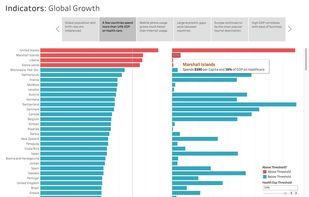


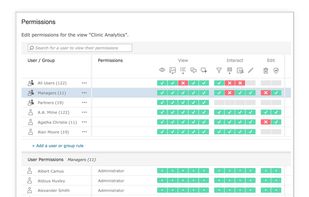
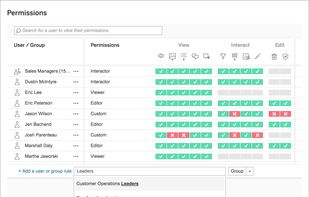
Sites and apps similar to Analyza include Tableau, which has a free version. Other options are Amazon QuickSight, Zoho Analytics, QlikView and Pentaho. You can choose from more than 10 Business Intelligence Tools like Analyza for Windows, Mac, self-hosting, Linux and iPhone.
Tableau helps the world’s largest organizations unleash the power of their most valuable assets: their data and their people.
United States
Amazon QuickSight is a very fast, cloud-powered business intelligence (BI) service that makes it easy for all employees to build visualizations, perform ad-hoc analysis, and quickly get business insights from their data.
United States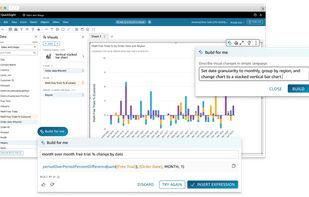
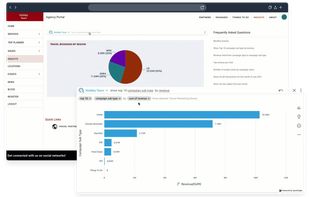
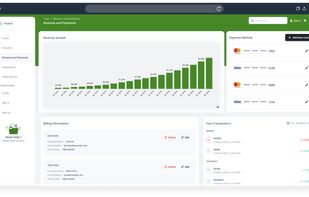


Create insightful reports & dashboards, Visually analyze your business information. Easily create insightful reports & dashboards using a drag and drop interface. No IT help required.
 India
India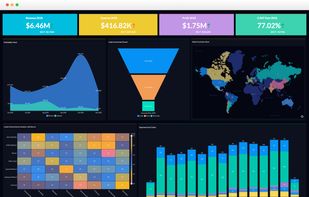


QlikView is Qlik’s classic analytics solution for rapidly developing highly-interactive guided analytics applications and dashboards, delivering insight to solve business challenges.
 Sweden
 EU
EU


Pentaho is a Business Intelligence software company that offers Pentaho Business Analytics, a suite of open source products which provide data integration, OLAP services, reporting, dashboarding, data mining and ETL capabilities.
United States


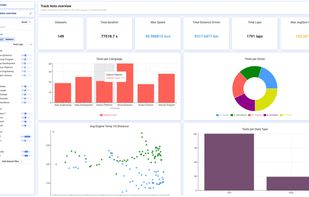
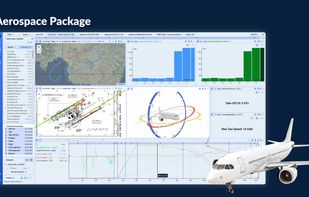
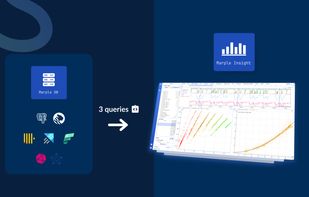
Marple Insight offers powerful tools for interactive analysis of high-frequency time-series data. Engineers and scientists from automotive, aerospace and manufacturing use it to explore, visualise, and analyse sensor or test data.
 BelgiumEU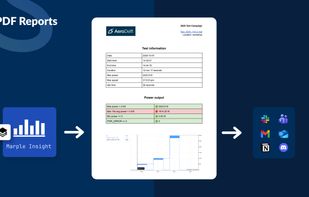


Sisense is a business intelligence and data analytics software that lets non-techies join, analyze, and visualize multiple large data sets in interactive dashboards.
United States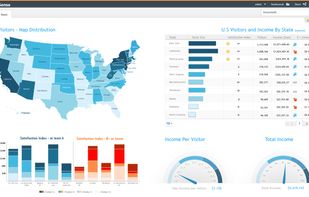


A business intelligence tool that includes ad hoc reporting, self-service data visualization and dashboards, predictive analytics, mobile apps, and more.
 GermanyEU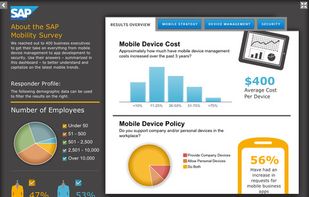
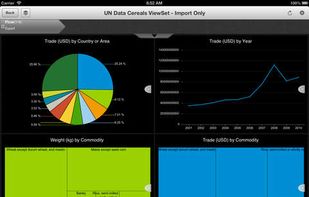



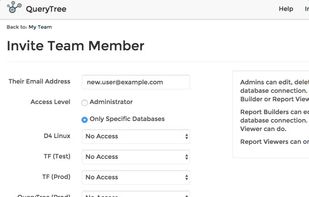
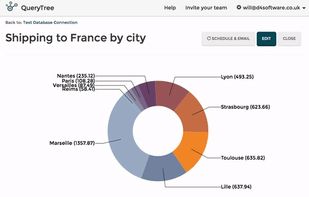
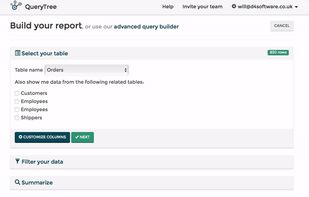
QueryTree is a flexible and powerful database reporting tool. Simply connect your database and start visualizing your data in minutes. Everything works with a dropdown menu interface - no code or SQL needed.
 United Kingdom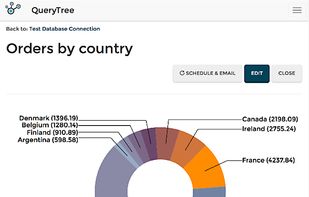


Phrazor summarises data into a few bullet points, highlighting key insights required for decision making. It helps enterprises make their reports and insights easier to comprehend by writing a narrative along with each report.
United Kingdom


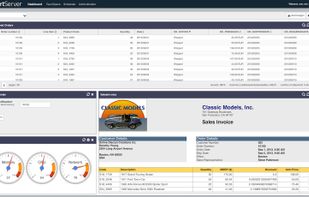
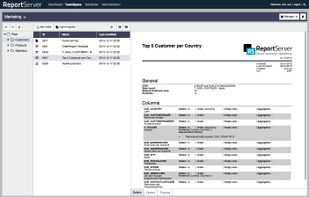
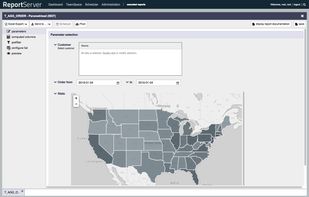
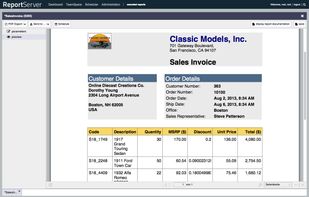
ReportServer is a web-based business intelligence platform that offers everything you need to evaluate your business. ReportServer comes with powerful ad-hoc analysis tools as well as with support for OLAP and pixel-perfect reporting.


Stagraph is new professional tool for visual data exploration and statistical graphics. This tool brings data science features and functions of R language to user without the need of coding. Your workflow in software is as follows: