ParaView is an open-source, multi-platform application designed to visualize data sets of size varying from small to very large.
Cost / License
- Free
- Open Source
Since
- Since 2013


ParaView is an open-source, multi-platform application designed to visualize data sets of size varying from small to very large.

Siren is an all-in-one investigation platform that safeguards people, assets, and networks by integrating data from open sources, vendors, and classified channels.
 United States


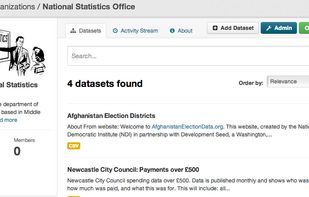
A complete out-of-the-box software solution that makes data accessible – by providing tools to streamline publishing, sharing, finding and using data.
 United Kingdom
 tap into data

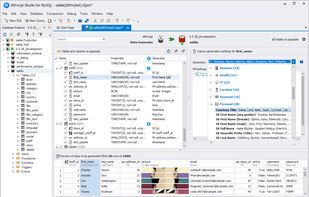
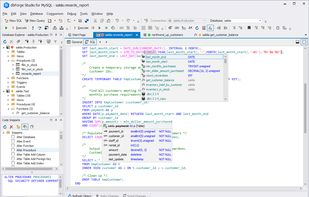
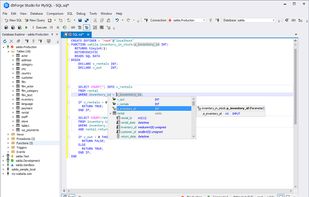
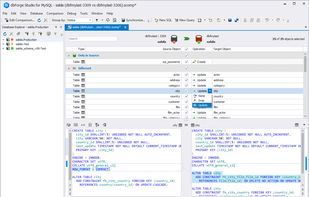
dbForge Studio for MySQL is the universal MySQL and MariaDB client for database management, administration and development. With the help of this intelligent MySQL client the work with data and code has become easier and more convenient.
 Czechia
 EU

New spreadsheet technology used to handle multi-dimensional data. Morphit is designed specifically to deal with complex high dimensional problems. It provides the flexibility to deal with the changing nature of biological studies and simplifies the process of capturing and...


Offline mobile forms support multilingual field surveys on any device, with secure data management, real-time dashboards, charts, maps, and exports.
United States


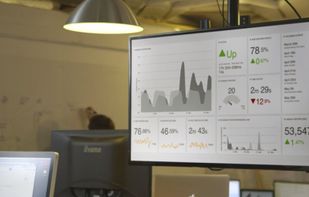
Geckoboard is a TV KPI dashboard that helps you and your team stay focused on the KPI that matter and monitor important business metrics.
United Kingdom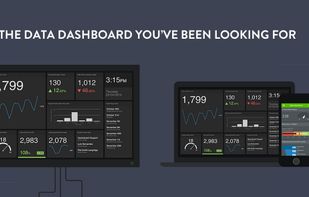




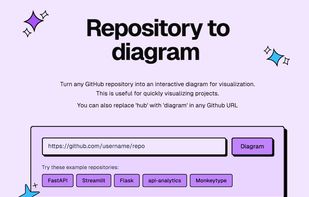
Turn any GitHub repository into an interactive architecture diagram. Replace "hub" with "diagram" in a GitHub URL.
 Canada

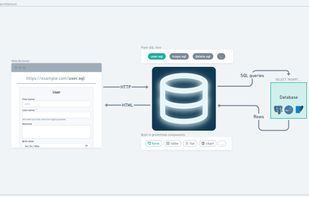
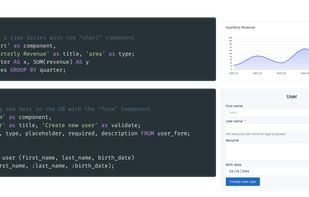
SQLPage is an open-source low-code web application development framework. It allows users to build and deploy web applications quickly and easily using only simple SQL queries. SQLPage is compatible with multiple databases including SQLite, MySQL, and PostgreSQL, enabling...
 Madagascar

 DBeaver

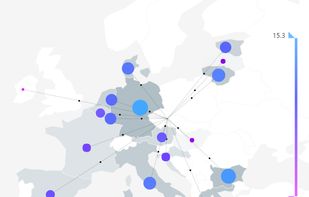
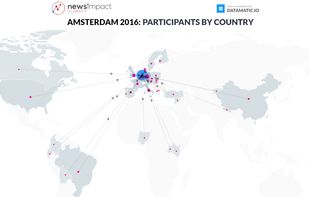
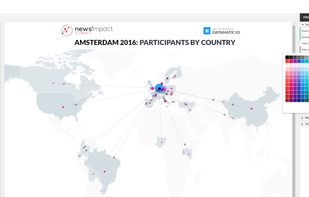
Datamatic is like WordPress for data visualizations, it offers 70+ interactive data visualization templates, Excel-like data editor & beautiful material design styles. Data visualizations can be easily embedded in any website or web application.
CzechiaEU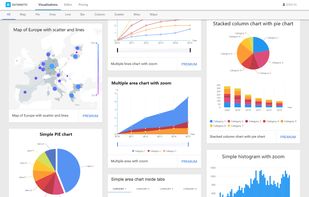

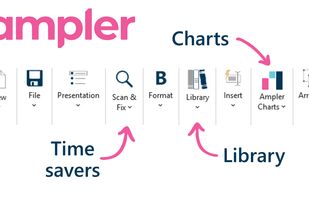
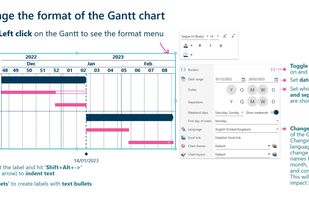
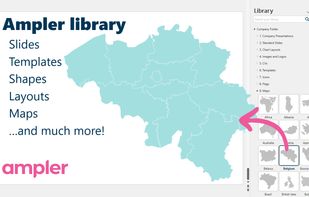
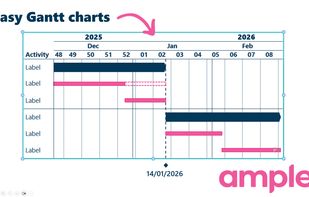
Ampler is a add-in for the Microsoft Office suite including PowerPoint, Excel, Word, and Outlook. Ampler Charts is a chart add-in for PowerPoint including amongst others Gantt and Waterfall charts.
 DenmarkEU


Frappe Insights is an open-source data visualisation and analytics tool that helps you to analyse and optimise your business. It has been designed for a predictable and great user experience. It is built on top of Frappe Framework and is available for free.


Lampyre - an efficient data analysis and OSINT multi-tool for everyone. Obtain, visualize and analyze data in one place to see what others can't.
 FranceEU


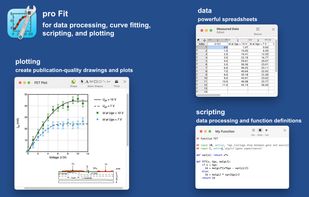
pro Fit, the best curve fitting, regression, plotting, data analysis for macOS. Python and LaTeX support, publication quality plots.


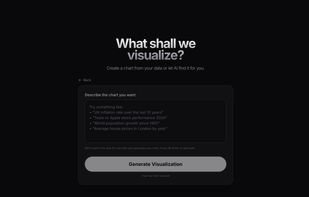
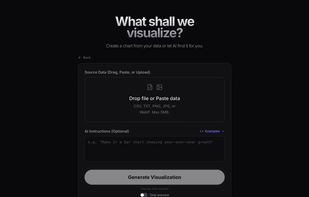
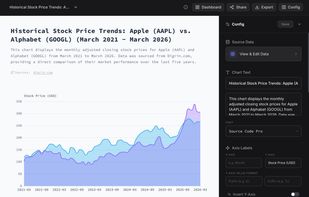
AI-powered chart generator that creates visualizations from natural language. Searches the web for real data, converts screenshots to editable charts, and exports publication-ready graphics.
United Kingdom
 Canvaand






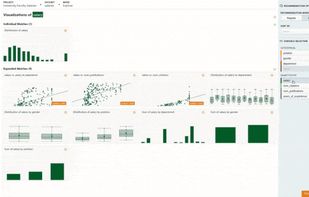
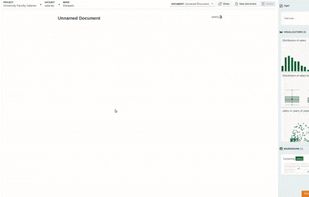
Lightweight data exploration tool combining semi-automated visualization and point-and-click statistical analysis into a unified workflow.
United States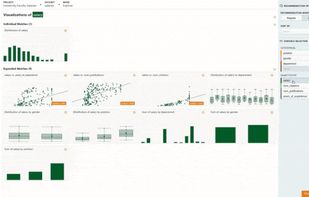


Data Elixir helps data scientists and engineers stay current with the latest news and technologies. We track down the best data-related news, resources, and inspirations from around the web each week and publish the collection as a free newsletter.


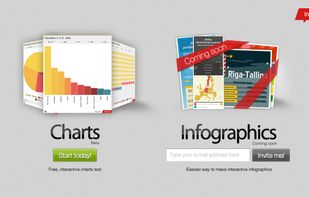
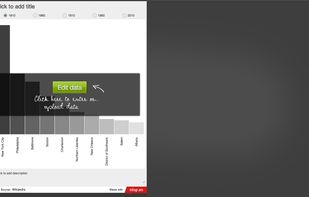
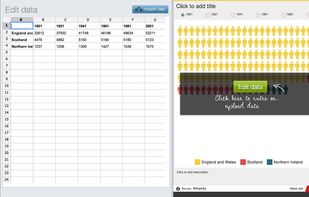
Infogr.am is a web-based software that let's you create professionally designed infographics in minutes. No programming or design skills needed.
 LatviaEU


Vega-Lite provides a higher-level grammar for visual analysis, comparable to ggplot or Tableau, that generates complete Vega specifications. Vega-Lite specifications consist of simple mappings of variables in a data set to visual encoding channels such as x, y, color, and size.
United States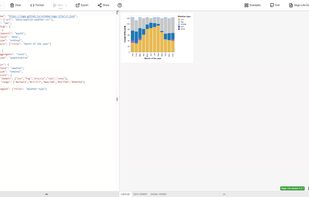
 United States



Snappy Mapper lets non-GIS users create geospatial vector data via a simple interface. Collect points and polygons, then export or access them via API — no GIS skills needed.
United Kingdom

ModbusScope is a graphical user interface tool designed for logging data using the Modbus protocol. It enables users to visualize the data in graphs while logging continues, and supports exporting the data to a CSV file for later analysis.


 Germany