Most portfolio trackers tell you what you own and what it's worth today. Vicenda also tells you what it could be worth tomorrow.
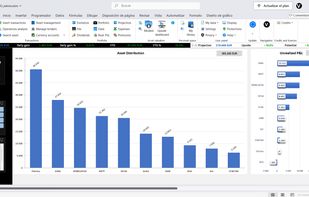
It runs inside desktop Excel and connects the analysis you already do, whether DCF, multiples or any model you've built, to your real positions. You declare a conservative, base and optimistic valuation for each company, and Vicenda combines them with current prices to show:
• A potential panel comparing upside across every asset you've analyzed, whether you hold it or not.
• Projections of your total portfolio value at 1 to 5 and 10 years, by scenario, in upside, IRR or EUR.
Your models stay yours: no templates, no imposed structure. Valuations are linked by cell reference, so when you change a model, the whole portfolio view updates.
Portfolio management is complete in its own right:
• Multiple portfolios, multi-broker and multi-currency tracking
• Automatic end-of-day quotes for stocks, ETFs, funds and crypto across many markets
• Custom assets for anything: stocks whose automatic quote you can't find, options, startups, real estate…
• Two independent category groups to slice your portfolio any way you want
• Tracking of realized P&L, dividends and option premiums
Maximum customization and extensibility: create your own sheets, dashboards and calculations inside the workbook and, with basic Excel/VBA skills, extend it without breaking the core system.
Maximum privacy: your data stays on your computer.
Bilingual interface (Spanish and English). Works out of the box with comma-decimal, day/month/year Windows regional settings (Spain, most of Latin America and continental Europe); other regions need a 2-minute fix shown at startup.
Free 15-day trial, no credit card required. Built for self-directed investors who run their own numbers.






 EU
EU


 Vicenda


No comments or reviews, maybe you want to be first?