


Salford Systems specializes in providing new generation data mining and choice modeling software and consultation services.
Cost / License
- Paid
- Proprietary
Application type
Platforms
- Online


Apps similar to Tableau include Grafana, which is open source with a free version. Other options are RAWGraphs, Metabase, Microsoft Power BI and Gephi. Business Intelligence Tools like Tableau are a crowded field, with more than 100 alternatives for the web, Windows, Mac, self-hosting and Linux.
Salford Systems specializes in providing new generation data mining and choice modeling software and consultation services.

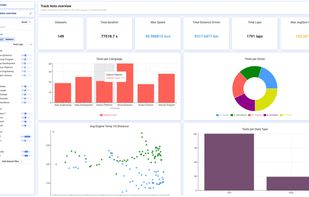
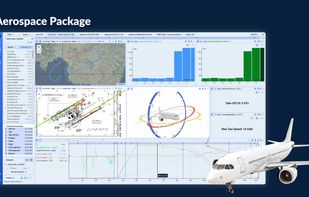
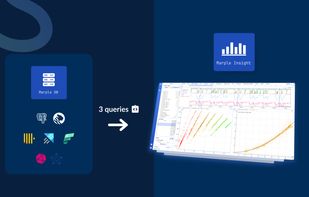
Marple Insight offers powerful tools for interactive analysis of high-frequency time-series data. Engineers and scientists from automotive, aerospace and manufacturing use it to explore, visualise, and analyse sensor or test data.
 Belgium
 EU
EU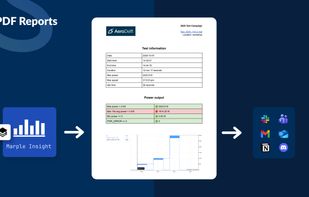


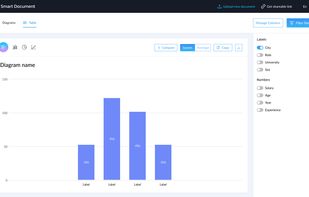
Smart Documents helps to understand the data without training. Just upload your table in "XLS" or "CSV" formats, filter the data and build a visualization.


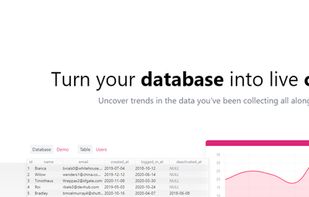
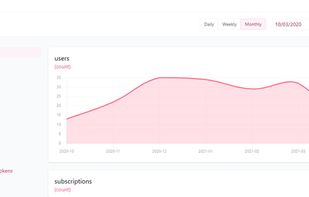
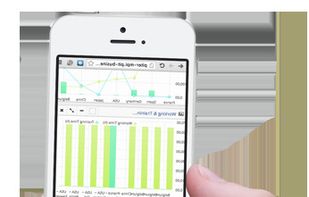
Uncover trends in the data you have been collecting all along. Automatically generate charts from your live database without writing code.


"Voyager 2 is a data exploration tool that blends manual and automated chart specification."


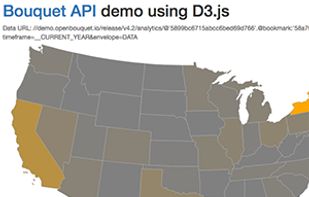
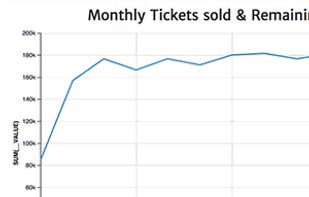
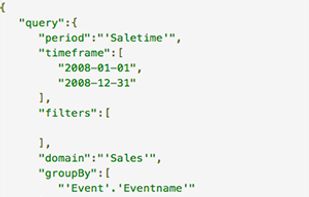
Bouquet automatically generates REST API endpoints for front-end developers to focus on UX and visualizations with HighCharts, D3.js and others.
 United States


dc.js is a JavaScript charting library with native Crossfilter support and allowing highly efficient exploration on large multi-dimensional dataset (inspired by Crossfilter 's demo). It leverages d3 engine to render charts in CSS friendly SVG format. Charts rendered using dc.
United States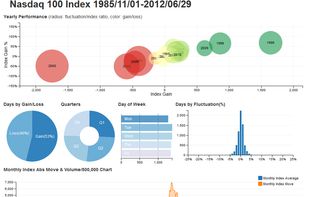


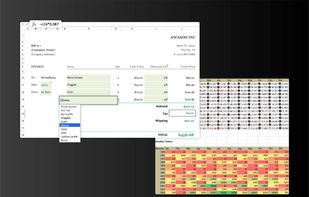
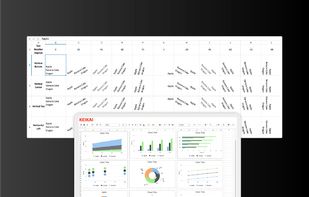
Keikai is the only Web Spreadsheet designed and architected for big data — and is the fastest web spreadsheet regardless of size. Other advanced features include embeddable in your Web Apps, providing true Excel experiences and more.
 Taiwan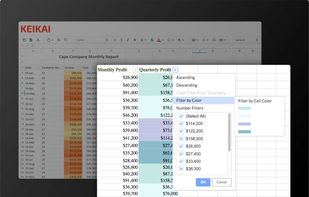


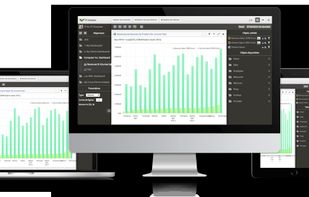
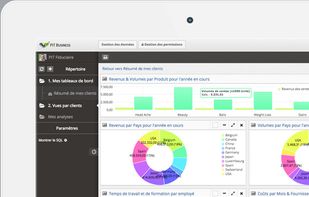
Complete Business Intelligence Web 2.0 solution for SME projects from 10,000€. Easy to use for non IT professionals, fast data analysis, and quick deployement. The ideal partner to pilot the key indicators of your company.



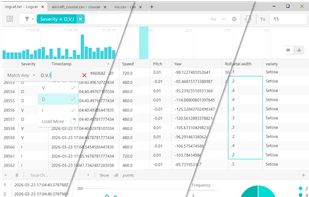
Hitomi opens CSV or data/logs in non-standard formats instantly and offers intuitive and powerful filtering and analysis options.


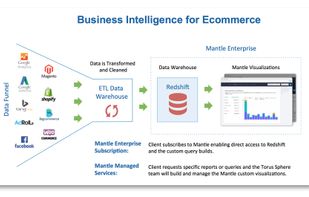
Data visualization tool for enterprise-level e-commece metrics. Get business intelligence insights quickly and easily.


One goal of Sympathy for Data is to enable users to handle data from many different sources and formats with ease. Connect to databases, select files from different network drives or automatically perform analysis on thousands of Excel-files on your local drive.


